A brief summary of climate and hydrological conditions in the region.
This service is regularly updated during periods in which closer monitoring is required (regardless of time of the year), in recognition that there is potential for dry spells, or irregular hydrological recharging. It does not define an official council position on drought or drought declaration. Outside of dry periods, less frequent updates synchronise with our latest seasonal outlooks.
Updated 16 June 2026
Next update due when there is a significant change of conditions or a new seasonal outlook.
Background
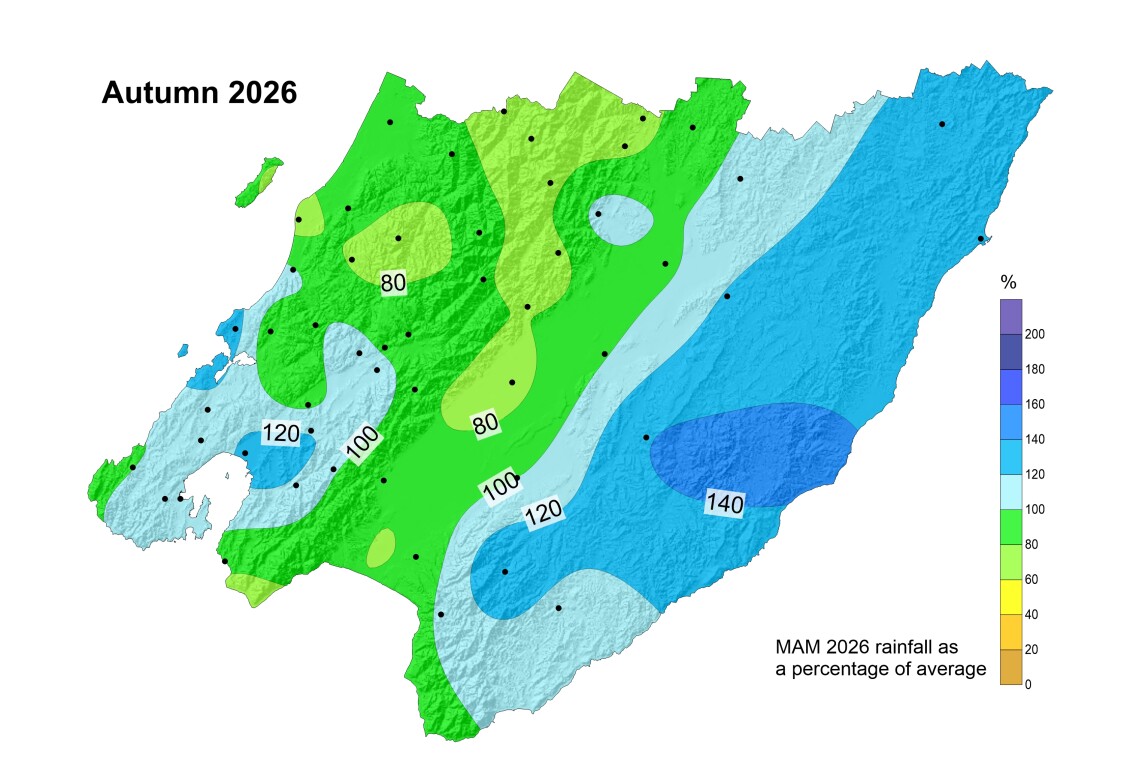
Autumn 2026 was characterised by a dying La Niña with residual easterly flows. There were occasional atmospheric river events and flash flooding thunderstorms around the region. It was a very variable season, albeit mostly mild, continuing the overall tendency for above average rainfall on the eastern Wairarapa coast. Winter, however, started with a wet signal on the west coast, with increased westerly flows. This tendency for predominant westerly flows should continue to gather momentum as a new El Niño is expected to develop going into late winter and early spring.
Current situation
Soil moisture levels were sitting at the above average mark around mid-June, with a more westerly flow rainfall regime starting to take place. Groundwater levels are generally holding up and tracking well within the historical normal range for early winter.
Meteorological outlook
International climate models are predicting that a new El Niño (i.e. positive ENSO event) will continue to develop and eventually turn into a strong event towards the end of the year, with potentially significant impacts. While there is some uncertainty regarding the maximum strength of this event, various models suggest that it could be as strong as the historical 1982-1983 and 1997-1998 El Niños or possibly turn out to be one of the strongest El Niños in recorded modern history. Traditionally, the Wairarapa tends to be drier than normal during strong El Niños, even though the severity of the dryness would depend on the extent of the local oceanic temperature anomalies, which currently remain warm and hence could work against a more severe dryness. Basically, it is still too early to know for sure how dry the region will likely be during the peak phase of this event, but we strongly recommend a close monitoring of how the hydrological system will evolve between winter and early spring. Apart from the Equatorial Pacific, a closer look into the Indian Ocean Dipole going into spring, and the local sea surface temperature anomalies around New Zealand by September (which can act to ameliorate the traditional ENSO impacts as mentioned above) will also help determine the likely severity of the impacts later this year and going into 2027. At this stage, the chance of at least some localised drought in the Wairarapa later in the year or into summer 2027 can be estimated to be around 60%, based on historical data and the likely strength of the incoming El Niño combined with other climate drivers.
Climate change
The ‘normal’ longer-term water balance is becoming increasingly hard to maintain quite possibly due to climate change influences, and increased high frequency climate variability, with more unreliable weather patterns. Droughts are expected to become more severe and frequent in the Wellington region, particularly in the Wairarapa. Even if international climate policy efforts were to successfully contain global warming under 1.5-2 degrees (the Paris Agreement’s ambition), it is important that we enhance our water resilience and be prepared for more unreliable climate patterns with both extreme dry and extreme wet periods. We note that the warming of the land also means that evapotranspiration will greatly increase, so the soil will likely need more ongoing rain to maintain ideal moisture levels, compared to what it has needed in the past.
View the latest national drought index state
View the national drought forecasting dashboard
View the latest seasonal report:
Climate drivers and seasonal outlook for the Wellington Region - Autumn 2026 summary Winter 2026 outlook
date_range Published 15 Jun 2026
Download now (PDF 2.1 MB) get_appBrowse the data
Anomaly Maps
How different has recent rainfall/soil moisture been compared with the same time in previous years?
Site-specific graphs
| Area | Rainfall | Soil Moisture |
| Kapiti Coast (lowland) | Otaki at Depot | |
| Kapiti Coast (high altitude) | Penn Creek at McIntosh | |
| Porirua | Horokiri Stream at Battle Hill | |
| Wellington City | Kaiwharawhara Stream at Karori Reservoir | |
| Hutt Valley (upper catchment) | Hutt River at Kaitoke Headworks | |
| Upper Hutt | Upper Hutt at Savage Park | Upper Hutt at Savage Park AQ |
| Wainuiomata | Wanuiomata River at Wainui Reservoir | |
| Wairarapa (high altitude) | Waingawa River at Angle Knob | |
| Wairarapa Valley (north) | Kopuaranga River at Mauriceville | |
| Wairarapa Valley (Masterton) | Ruamahanga River at Wairarapa College | Wairarapa College AQ |
| Wairarapa Valley (south) | Tauherenikau River at Racecourse | Tauherenikau River at Racecourse |
| Wairarapa (north-eastern hills) | Whareama River at Tanawa Hut | Whareama River at Tanawa Hut |
| Wairarapa (south-eastern hills) | Waikoukou at Longbush | Waikoukou at Longbush |
Get in touch
- Phone:
- 0800496734
- Email:
- info@gw.govt.nz