Learning more about Ruamāhanga Valley potential aquifers using SkyTEM
 Greater Wellington has used advanced electromagnetic survey technology called SkyTEM to learn more about what's below the Ruamāhanga Valley floor and identify where potential aquifers might be.
An aquifer is a layer of gravel or sand that holds or transports groundwater. Until now, we’ve found out about the rocks and water underground from drilling boreholes, which provides detailed information but only in a few locations.
SkyTEM lets us ‘see’ underground across much more of the Valley, and to depths we haven’t seen before.
In early 2023 we used a helicopter to fly SkyTEM equipment over the Ruamāhanga Valley to collect data about how the underlying geology responds to a mild electrical current. It took over two years to process and analyse the data, along with existing borehole information and develop models that identify and group layers of rocks, gravels, sands, silts and clays into geological units that indicate if they are potentially aquifers or not.
We’ve now made this information available through an online mapping tool. You can use it to explore Ruamāhanga Valley’s potential aquifers. Keep in mind: the tool shows where aquifers may exist, but it doesn’t confirm whether groundwater is actually present.
You can find this mapping tool in the “Explore the Potential Aquifer interactive map” section. Have a go!
This project is funded by Greater Wellington, Kānoa – Government’s Regional Economic Development & Investment Unit, Carterton District Council, Masterton District Council and South Wairarapa District Council.
The survey fights were undertaken by SkyTEM Australia and the project delivered by GNS Science (now part of the New Zealand Earth Sciences Institute) in collaboration with experts from Aarhus University in Denmark and input from Greater Wellington.
Watch to find out more
We’ve created a 3D interactive map of the Ruamāhanga Valley subsurface. This allows you to explore the various models developed from the data collected by the SkyTEM survey.
We encourage you to learn more about the models and layers and how to use the 3D interactive map.
A guide to exploring the Ruamāhanga SkyTEM data using the interactive mapping tool

Greater Wellington has used advanced electromagnetic survey technology called SkyTEM to learn more about what's below the Ruamāhanga Valley floor and identify where potential aquifers might be.
We’ve now made this…
Read more here
date_range Published 30 Jun 2025
Download now (PDF 679 KB) get_appIn short, the models displayed in the map are:
Aquifer Potential – This is a model of the likelihood that the subsurface is an aquifer. High aquifer potential indicates an area that is more likely to hold water-bearing material (such as gravel) than an area with low aquifer potential (such as clay).
Resistivity – This is a model of how easily the subsurface material can resist the flow of an electric current. Areas of high resistivity generally indicates layers that are more likely to hold water than those with low resistivity.
Hydrogeological Unit – This is a model that groups subsurface materials that have similar resistivity, characteristics, and age into broader hydrogeological units or layers.
With the 3D interactive map, you can create virtual wells or cross sections anywhere in the survey area. These tools will show you the modelled aquifer potential, resistivity, and hydrogeological units of the subsurface at a specific point or along a line (cross-section) that you draw.
|
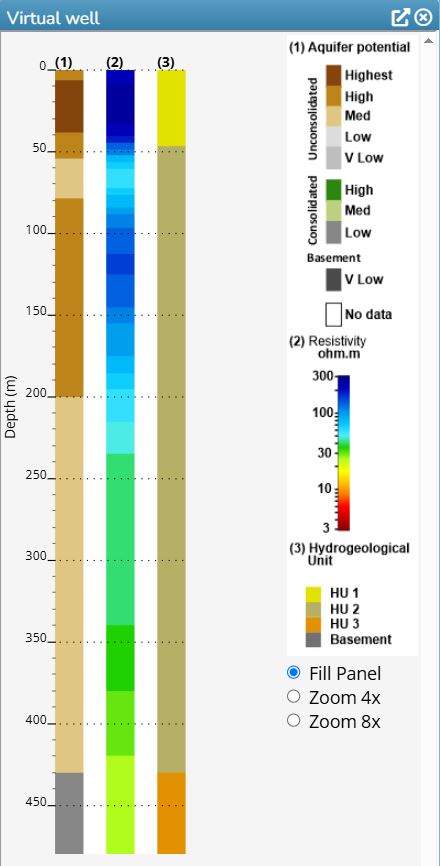
Virtual Well – click anywhere on the map using this tool to create a 1D profile of a virtual bore well. The output will look something like this:
|
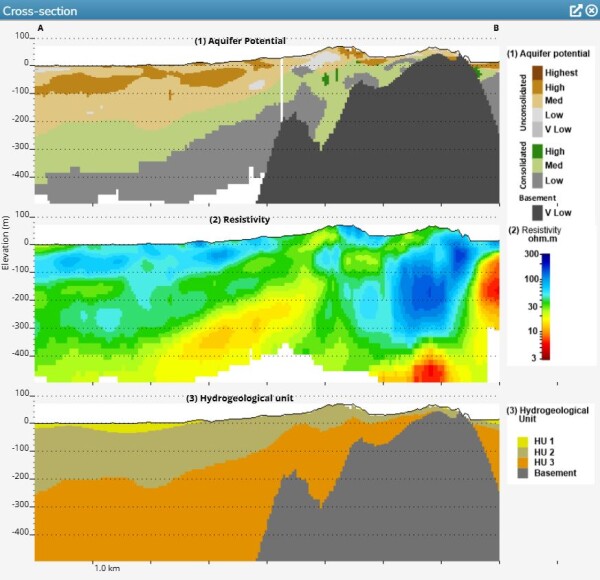
Cross-sections – draw a line anywhere on the map using this tool to create a 2D profile of the subsurface along the cross-section. The output will look something like this:
|
You can also learn more about how each of these models were created in the ‘Find out how the survey data is turned into models’ section or see the ‘Technical reports’ section for even more detail.
This project is a foundational piece of scientific work and an important step towards improved understanding of the Ruamāhanga Valley’s complex geology, potential aquifers (up to 300 metres underground), and how these might connect with each other and with surface water.
The resistivity and hydrogeological models provide valuable information to update our conceptual understanding of groundwater systems. These were previously developed through investigations and modelling undertaken in the 2000s and now include potential groundwater systems in areas and depths that we do not currently hold data for. The aquifer potential model helps us to visualize key areas of interest, for example where the geology suggests an aquifer might be, and where groundwater and surface water may be connected.
However, these models do not provide a map of groundwater and do not prove that water is present or how much might be flowing in or out of different potential aquifers. These models provide a useful guide only. More work will be required by technical experts to interpret the data and provide the appropriate information for consent application purposes.
Only some of the information from the SkyTEM outputs, such as the resistivity and hydrogeological models, can be used immediately.
As a landowner you could use it to:
- Think about how you might want to use your land depending on what is below ground
- Inform where you might want to drill a new bore to replace an old one.
Landowners would still need to engage technical expert(s) to interpret the outputs from the models to inform further investigations, modelling, technical and planning assessments that will be required in an Assessment of Environment Effects (AEE) for consent application purposes – noting that:
- SkyTEM data itself is not sufficient evidence so you will need additional information like drill bore logs, aquifer testing, and groundwater flow modelling
- Evidence needs to be more than proving water is there. We also need to understand the connections between aquifers and surface water and how a water take might affect these.
Greater Wellington will use the SkyTEM models to:
- Fill gaps in our knowledge about subsurface layers under the Ruamāhanga Valley. This will give us more certainty in the next phase of groundwater investigations and groundwater flow modelling
- Improve our understanding of Category A, B, and C groundwater boundaries and the connections between known and potential aquifers
- Work out where we might need further investigations, and how to change the Natural Resources Plan (NRP) to reflect this new knowledge.
It is important to understand that the existing NRP provisions (such as allocation limits and minimum flow restrictions) still apply. This may mean that in some catchments, particularly over-allocated ones, water takes may not be able to be consented. Because of this, landowners thinking about implications for their access to water should contact Greater Wellington before they make any significant decisions (such as investing in water storage options or deep drilling investigations).
Any rule changes that might occur from interpreting the SkyTEM data and subsequent investigations and modelling will need to go through a plan change process before being able to be used in a planning framework.
The data collected by SkyTEM is not being used for compliance monitoring. We only want Ito know about the geology under the valley floor – not what’s happening on your property.
As your Regional Council, Greater Wellington is responsible for making decisions about the region’s water; for example, how it’s allocated and used. Currently groundwater resources in the Ruamāhanga are stretched and many of the aquifers or ‘groundwater catchment management units’ are overallocated.
The foreword to the Wairarapa Water Resilience Strategy provided by mana whenua summarises the importance of water and the role of knowledge:
“… Water is the blood of the earth mother Papatūānuku and the rivers are her veins. It is her who has given us life from time immemorial and it is with her that solutions to climate change lie…
Climate change will affect our whole region, the land and rivers, lakes and coastal areas. We need to restore the natural processes that sustain them. We recognise that we live in a changed world. Restoring natural processes involves repairing, freeing up and empowering natural processes by cleaning rivers, supporting river flows, encouraging the flow of natural springs and retaining water in the natural ecosystem. We can do that with the benefit of both modern and traditional knowledge and practices.”
Learn more about water allocation at our water quantity allocation webpage and associated Natural Resources Plan allocations map.
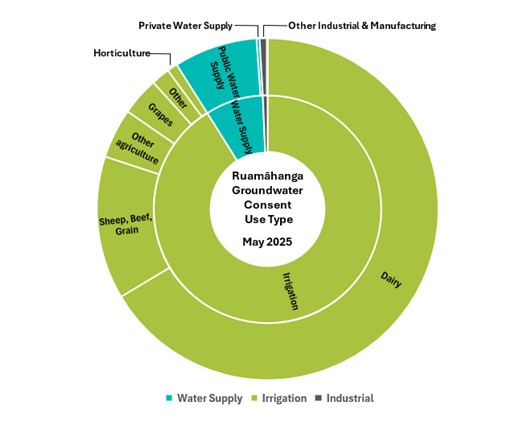
In the Ruamāhanga Valley, about 91% of the consented groundwater use is for irrigation, mostly for farming. Around 8% is used for water supply and the rest goes to industrial uses.
Right now, we know a lot about the volumes of water above ground in rivers, streams, lakes. But we don’t know much about the water below ground (groundwater).
The information from this SkyTEM project, provides a base for further information which will help us make better decisions about water. This is especially important when you consider how climate change could impact aquifers and the different interests in water, including:
- Security of municipal water supply and population growth
- Managing groundwater recharge zones
- Irrigation and other commercial activities
- Tourism activities
- Understanding the effects of groundwater abstraction on lakes, rivers, wetlands and saltwater
- Managed aquifer recharge
Things could look very different in the Ruamāhanga Valley in the future. This project will help with how we look at sustainably allocating water while still allowing for economic development. Pursuing the objectives in the Ruamāhanga Whaitua Implementation Programme, and in the Wairarapa Water Resilience Strategy, SkyTEM provides a key piece of information on potential groundwater availability. However, it is only one piece of the puzzle towards water resilience which will need many solutions such as water use efficiency, water capture, natural attenuation and land-use change.
The resistivity and hydrogeological models give us a much clearer picture of the Ruamāhanga Valley’s complex geology and potential aquifers, up to 300-metres underground. This is a major step forward – but not the full story.
To improve our confidence in these models and better understand how groundwater behaves we still need more information. This includes deep borehole data and aquifer testing.
The SkyTEM project is a first for Greater Wellington, and we are proud of the results produced so far. For some areas of the model, GNS scientists used their geological expertise to interpret the SkyTEM data where there was limited existing information (such as bore logs) to help with interpretation. That’s why our next steps will focus on validating the SkyTEM models with real-world evidence and understanding how the ground water moves and behaves, and how it could be affected by use.
Greater Wellington will be using the models to work with other councils and communities to identify priority areas for further investigations. Our goal is to build a strong foundation of evidence for making informed decisions on how to manage our natural resources efficiently and responsibly.
| What we have: | Where to from here: |
|---|---|
|
3D interactive map of the Ruamāhanga Valley subsurface providing virtual wells and cross sections of:
|
|
The following key steps are likely to be carried out in stages over the next few years. However, timeframes are only indicative as decisions and budgets are still to be confirmed.
Step 1: choosing the right places to focus on
Timeframe: Next 6 – 12 months
This first step is to decide which areas we need to focus on for more information. We’ll be working with mana whenua and stakeholders to find these areas. These might include:
- Places where we know there are information gaps in the current models
- Areas under resource use pressure
- Areas of importance suggested by mana whenua and stakeholders
Step 2: further deep drilling to learn more
Timeframe: Next 2 – 3 years
We intend to drill deep wells and carry out aquifer testing in some of the key areas identified in Step 1 to help confirm what the models show us and get more detailed information.
Drilling takes time and resources, so we expect to do this gradually – potentially one or two wells per year.
Step 3: Building better groundwater flow models
Timeframe: Next 3 – 5 years
Based on our updated understanding, we will then look to build more advanced numerical models that show how groundwater flows underground and interacts with other aquifers and surface water. These will more accurately assess the movement of water and the impacts of groundwater abstractions.
Step 4: Turning Knowledge into Action
Timeframe: To be determined
All this information will then feed into future water policies and planning processes. The better we understand the groundwater system, the better we can manage it – for people, the environment, and future generations.
Groundwater is the water found underground in the cracks and spaces in soil, sand, and rock. It is stored in and moves through geological formations of soil, sand and rocks called aquifers.
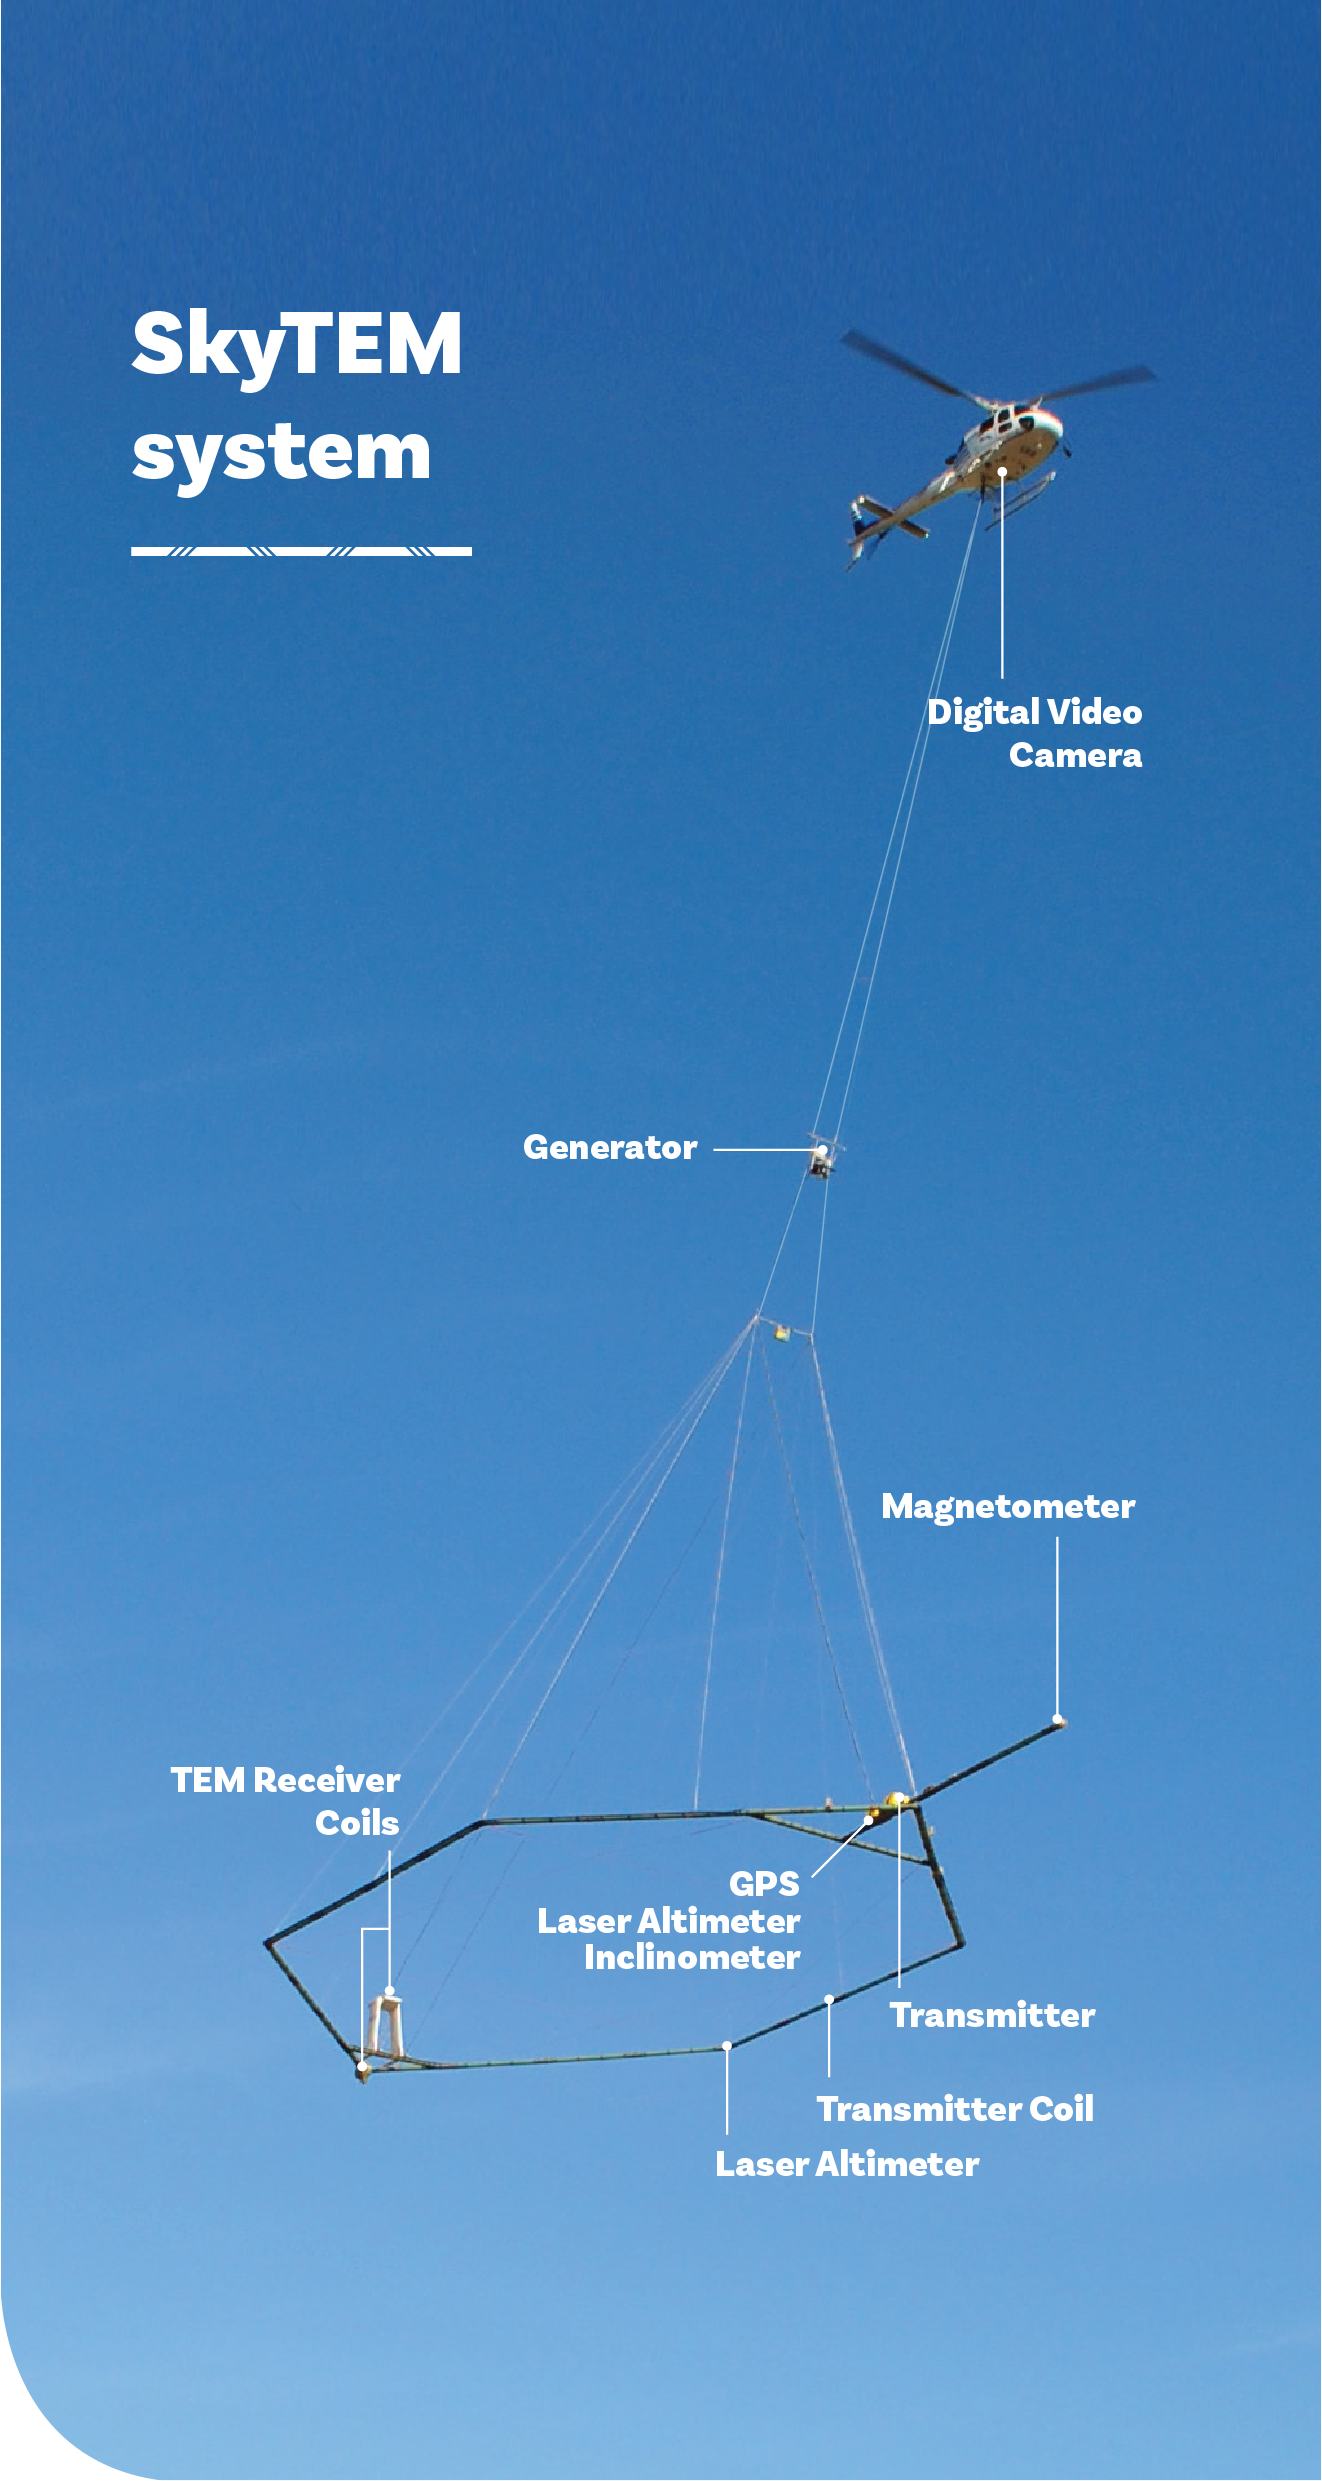
If you were in the area during early 2023, you might have seen a helicopter carrying the SkyTEM equipment which looked like a large hoop hanging from cables - around 50-metres above the ground. This technology is safe for people and animals. It’s no different to everyday activities like watching an LCD or plasma TV or blow-drying your hair.
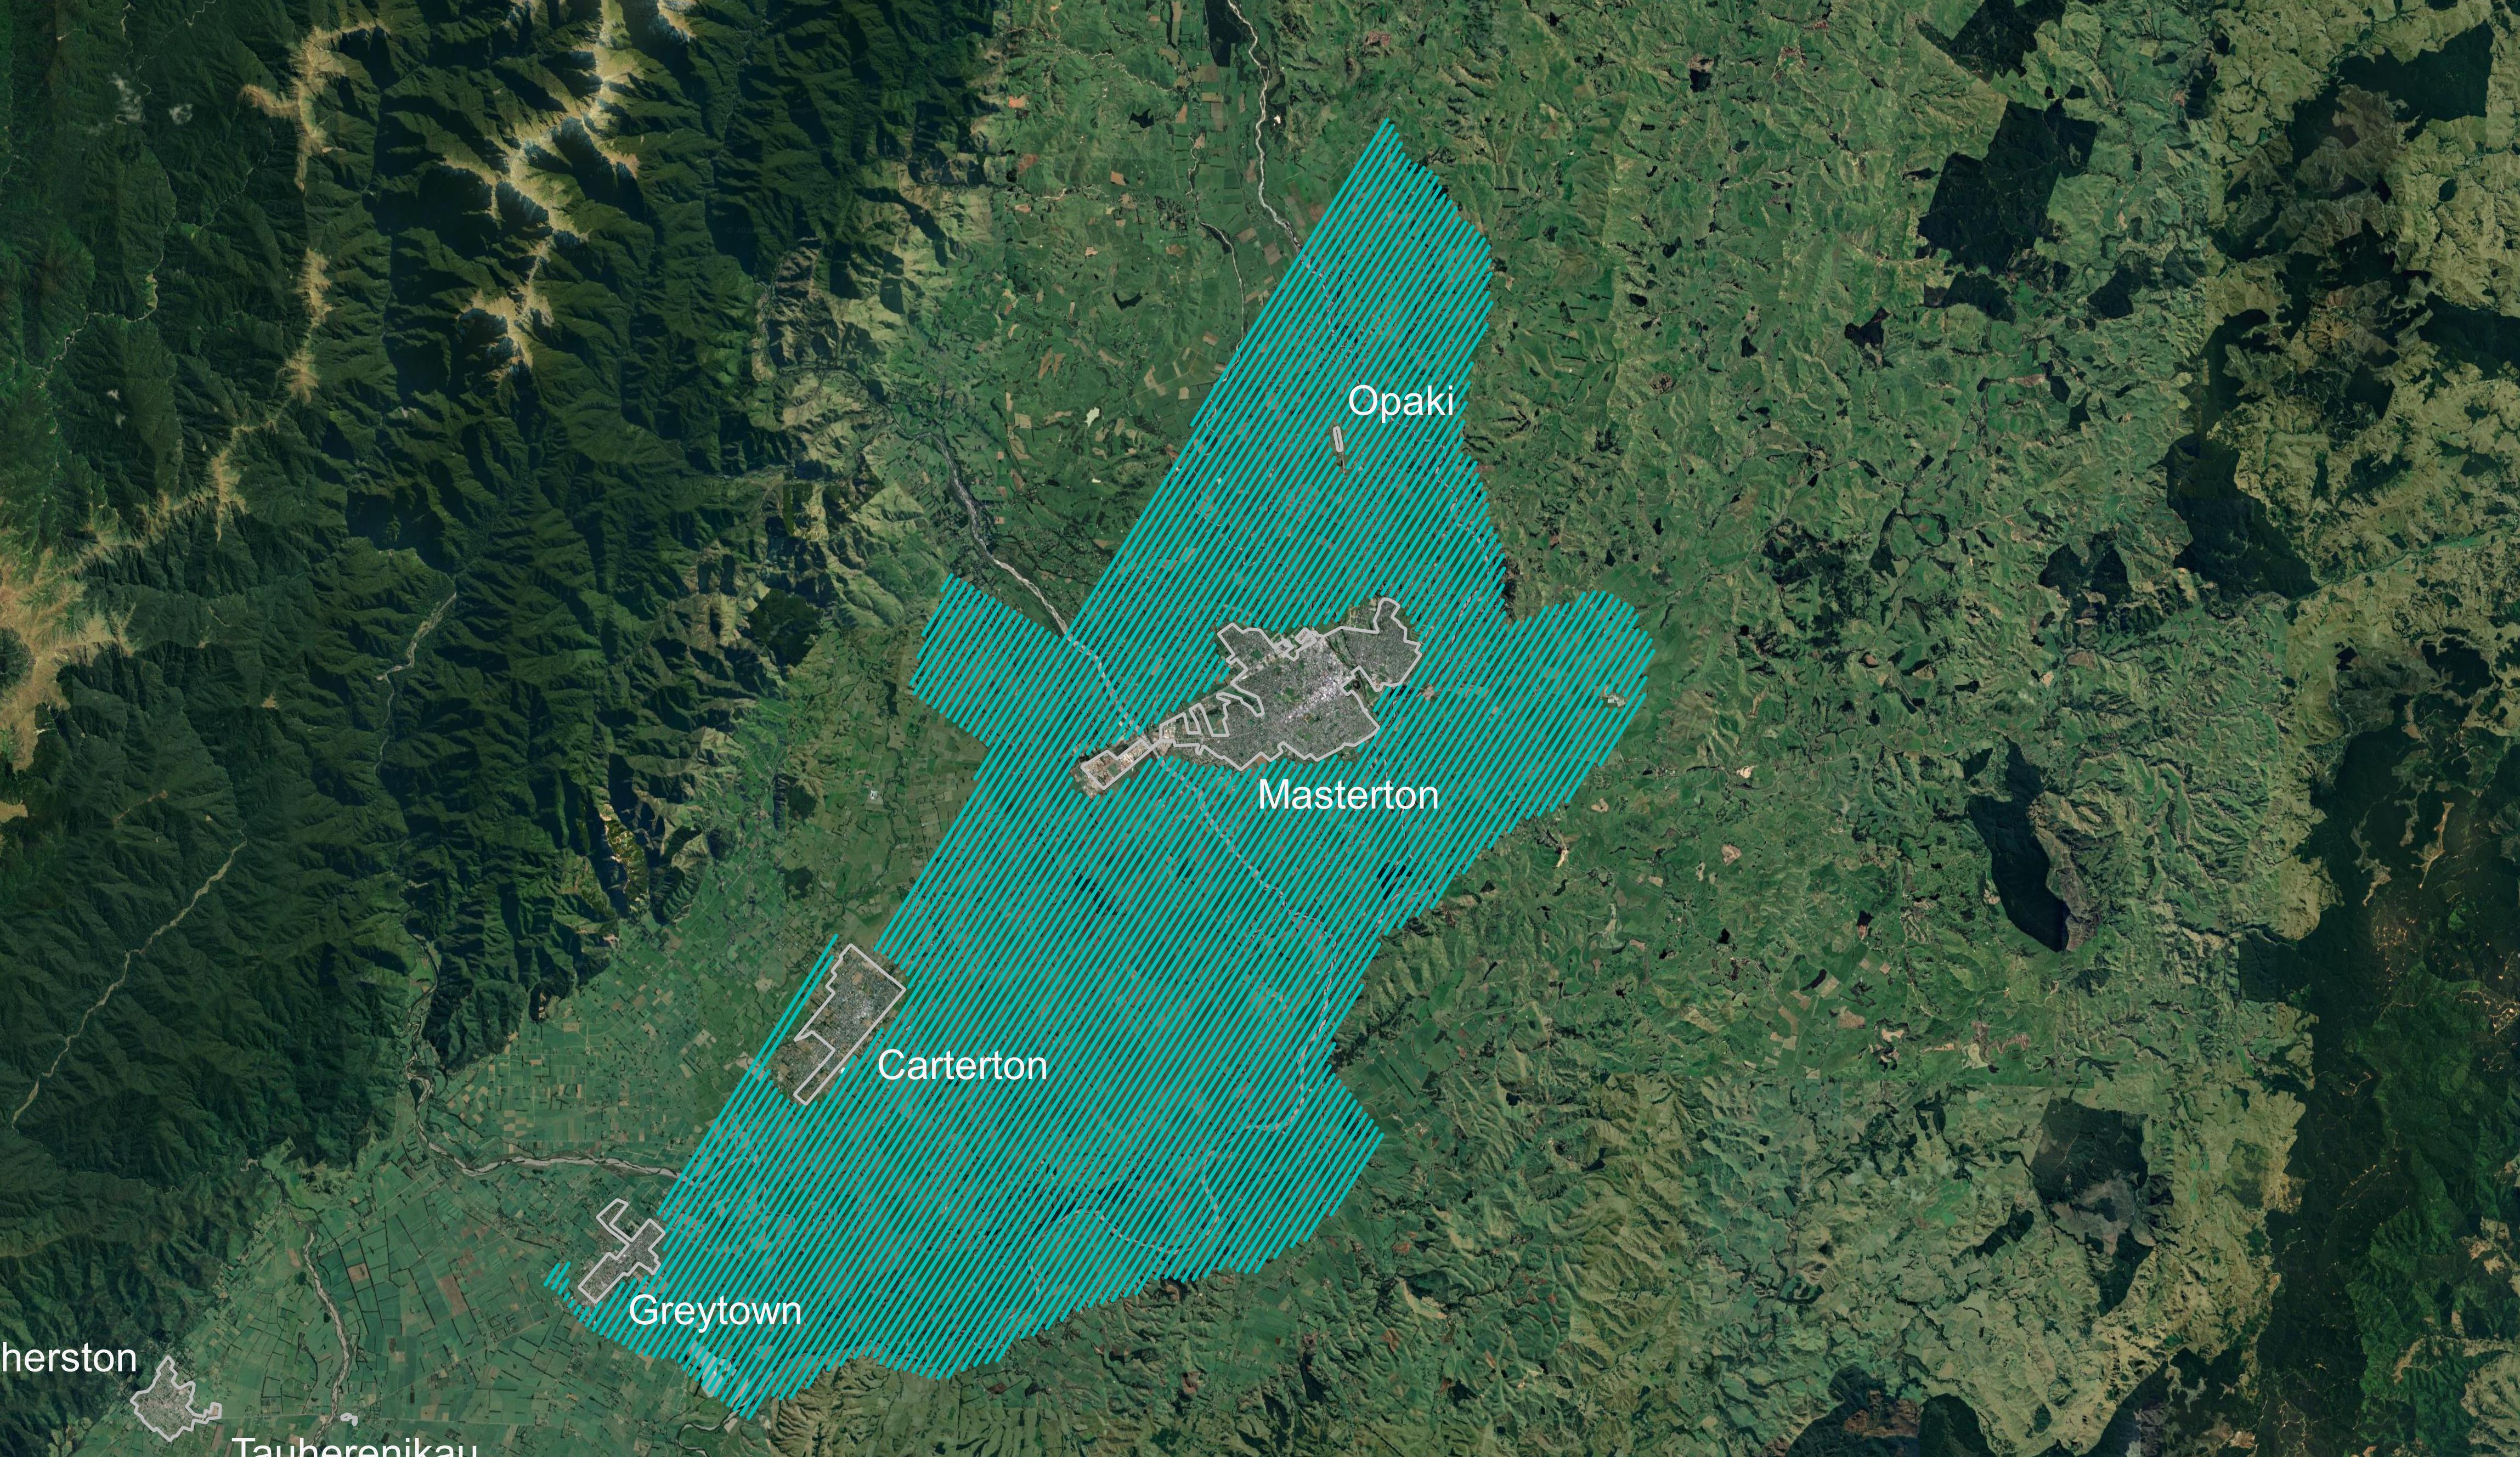
The Ruamāhanga Valley floor is roughly 1000 square kilometres. The helicopter scanned almost the entire valley floor flying in parallel lines to gain as complete a picture as possible of what is happening below the ground. The bulk of the survey lines were flown approximately 200-metres apart but in some areas where the geology is known to be more constant these flight lines were extended to 400 metres without affecting the resolution of the data.
As metal and electricity interfere with the signal from the SkyTEM equipment, the pilot avoided towns and houses in rural areas, and crossed perpendicular to roads, rail lines and power lines where possible.
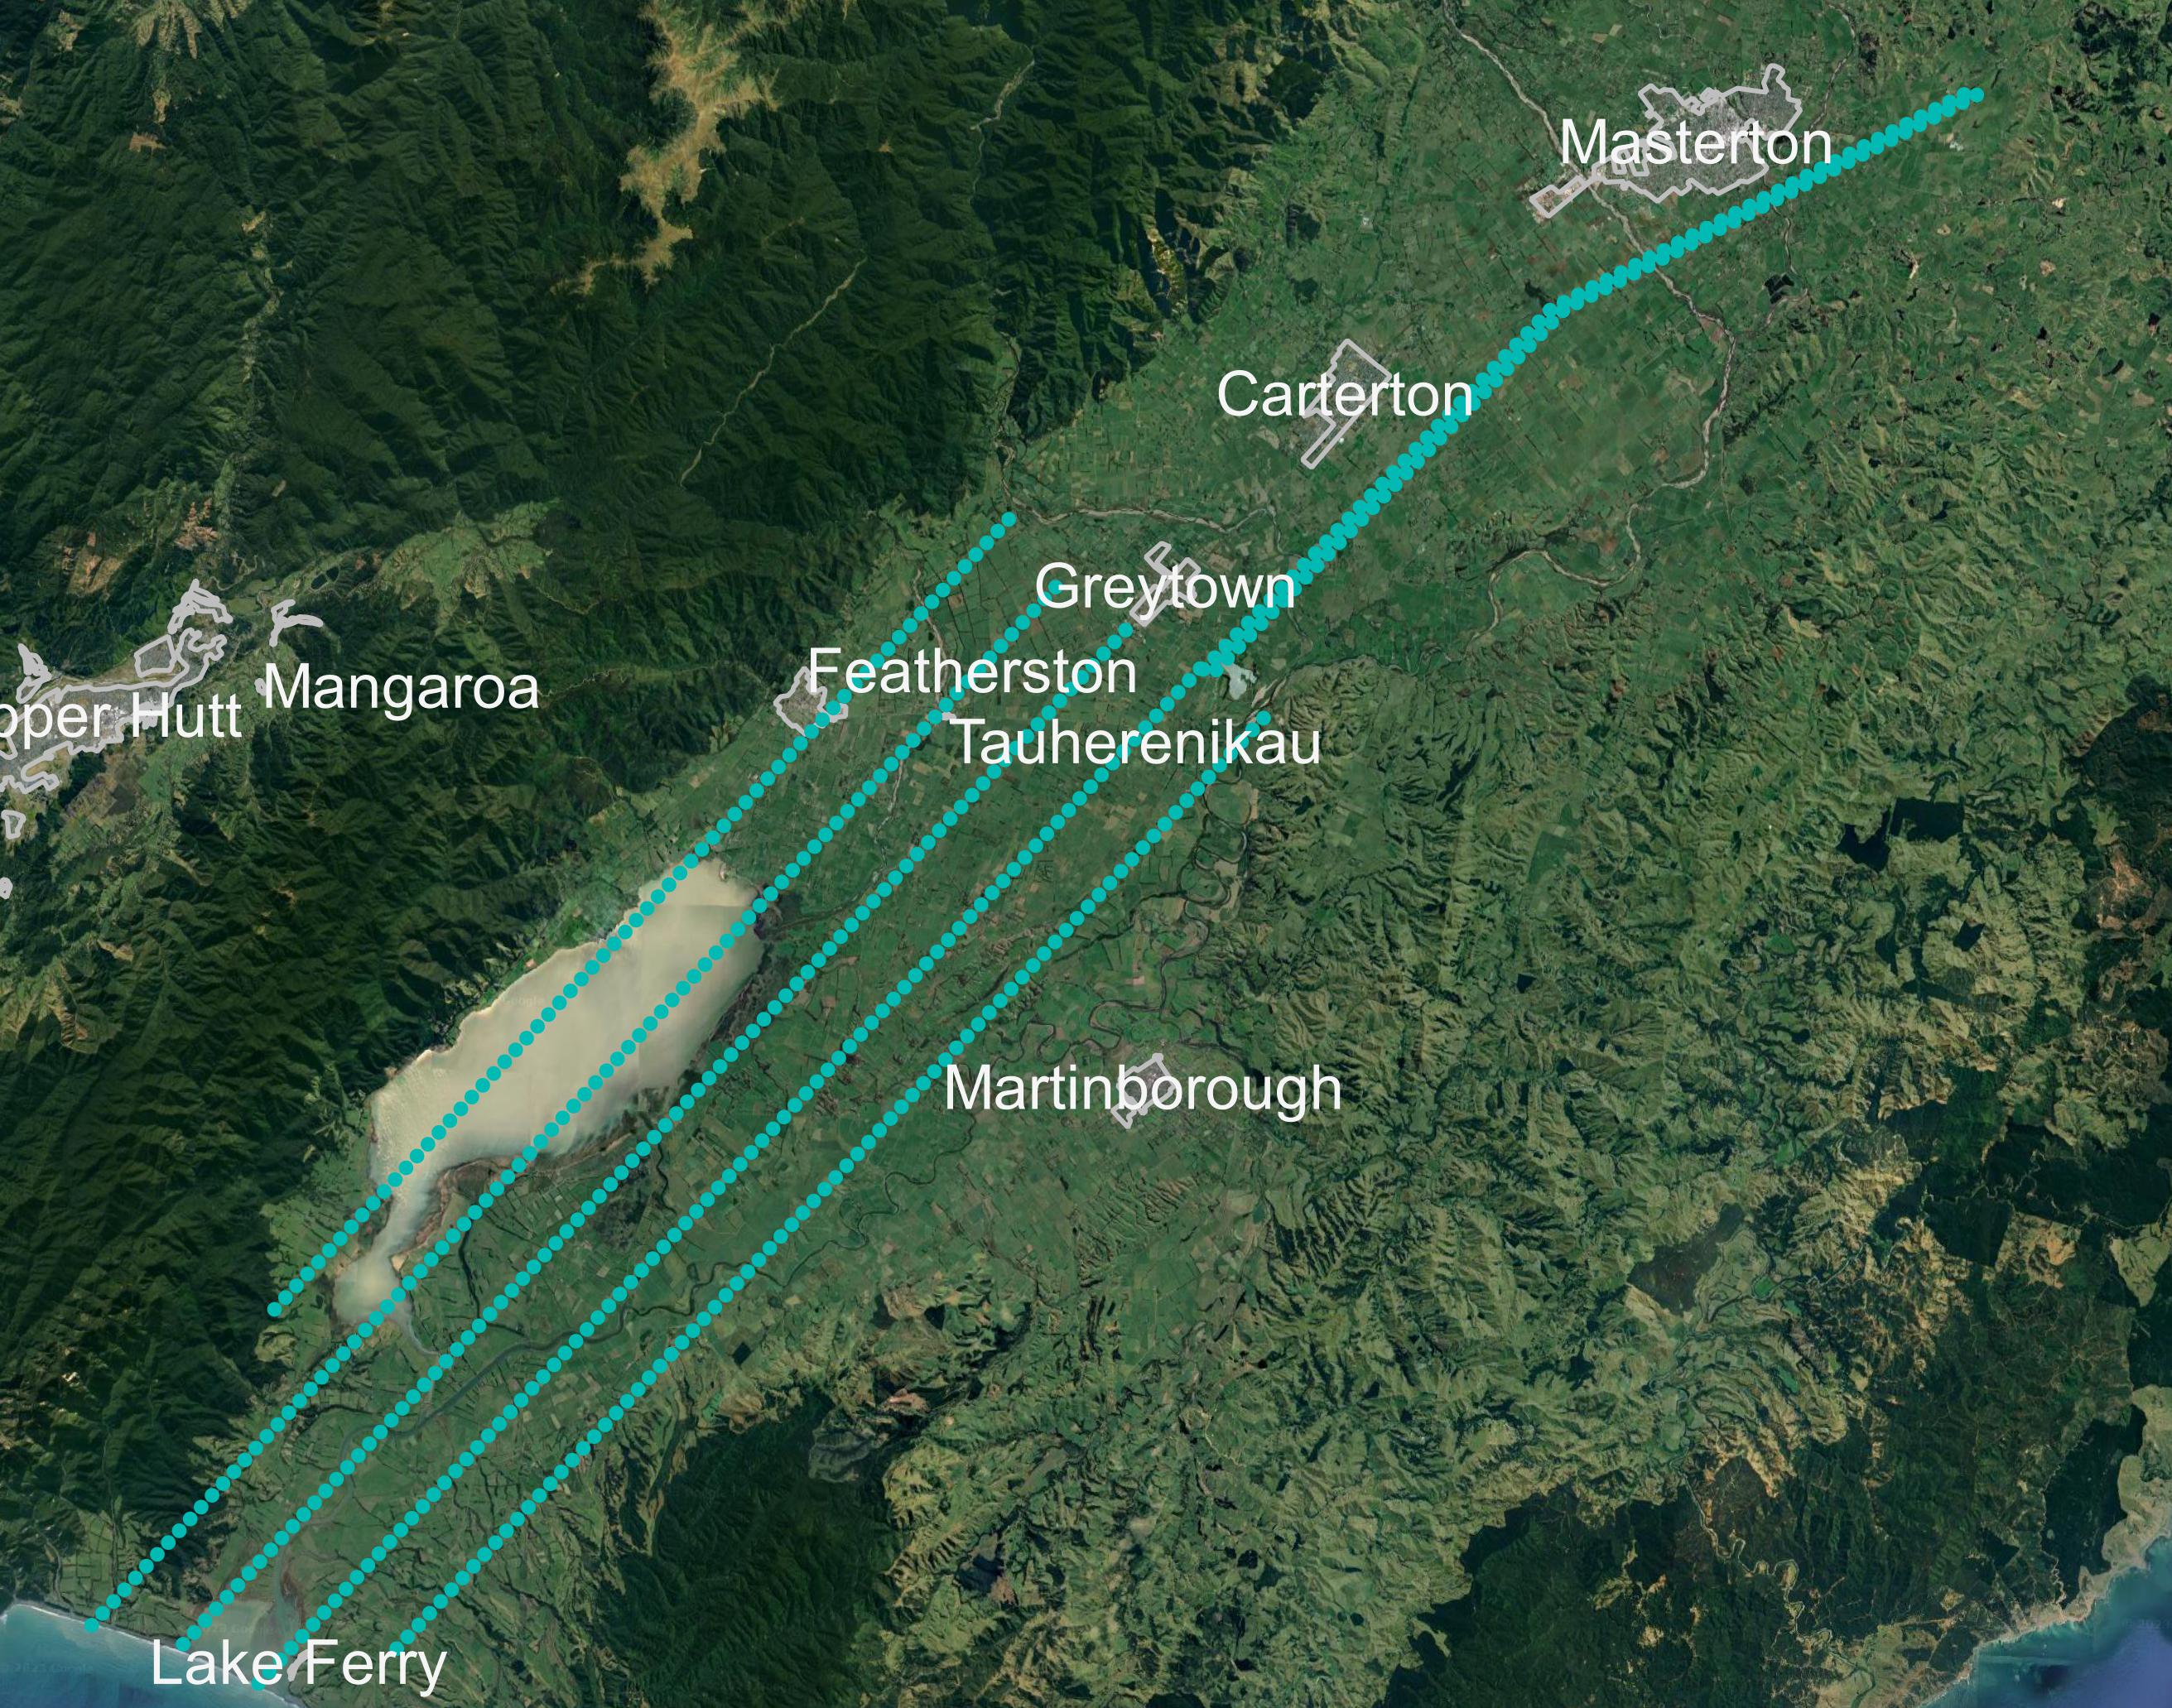
This map shows the flight lines of the SkyTEM helicopter took during its survey scan over the valley floor (the inset map shows the whole Ruamāhanga catchment in grey).
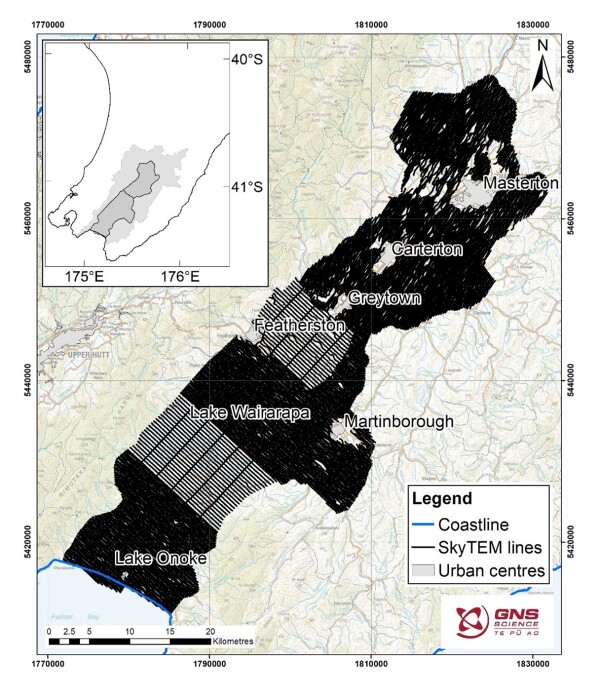
We collected a total of 5684 km of data during this aerial survey!
That’s a lot of data, which is why it has taken two years for GNS to process, check and interpret what it all means.
We owe thanks to SkyTEM for conducting this survey using their technology, which has been used successfully all over the world including Hawke’s Bay here in Aotearoa, and in sensitive environments like the Galapagos Islands and Antarctica.
Watch to find out more
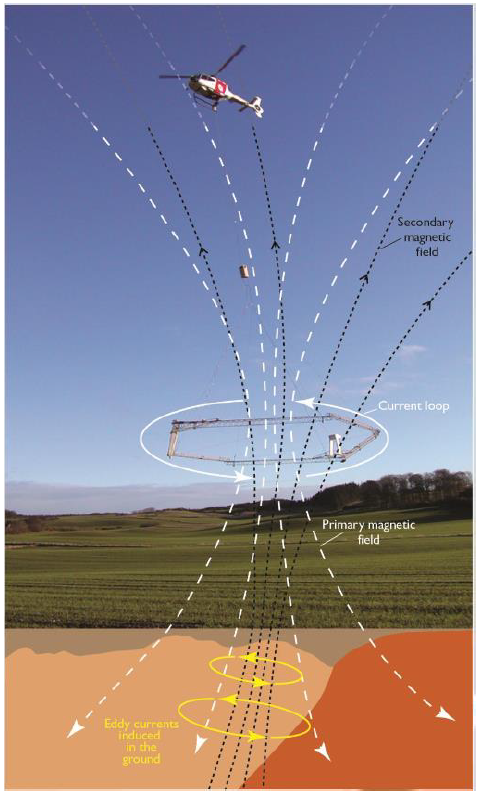
In basic terms: The electromagnetic SkyTEM system creates a gentle electrical current that travels down to an average depth of 400-metres underground.
This current behaves differently based on the materials it passes through underground. The equipment records how easily the current passes through different materials which helps us identify what materials underground layers are made up of. For example: sand, gravel, and clay.
In scientific detail: The SkyTEM system is an airborne transient electromagnetic system. The system uses a magnetic field to generate an electric current in the subsurface (an eddy current) and then measures the behaviour of that induced electric current. Such measurements can be used to infer subsurface properties relevant to understanding potential groundwater resources.
As rocks are composed mostly of silicate minerals that are essentially insulators, electrical conduction is dominated by electrolytic conduction, and depends mainly upon porosity, permeability, moisture content, concentration of dissolved electrolytes, temperature and phase of pore fluid, and amount and composition of clay content.
Groundwater acts as an electrolyte and so increases the conductivity of water-bearing lithologies. This conductivity increase depends on the volume of water as well as the chemical composition of the water. Fresh water is resistive, but contaminants such as clays and/or salt will increase its conductivity.
SkyTEM airborne electromagnetic survey technology was developed by the Danish Government and Universities to make efficient and effective mapping of groundwater resources possible.
The technology has been used commercially since 2004 to map large aquifer systems in countries including Denmark, Netherlands, India, USA, Canada, Australia, and New Zealand.
SkyTEM technology can map the subtle changes between sand, clay, silt, and gravel that define the location of lithologies capable of carrying groundwater resources.
The data from the Ruamāhanga Valley SkyTEM survey flight lines were first processed to correct for things like flight altitude, tilt, roll and pitch of the helicopter and equipment. Any electromagnetic ‘noise’ from things like roads, powerlines, buildings, underground cables, railway tracks was also removed, as it can lead to false readings. In areas closer to the coast salinity was also corrected for.
Creating a resistivity model
The data was then converted from electrical conductivity to electrical resistivity to tell us more about the geological layers in the data.
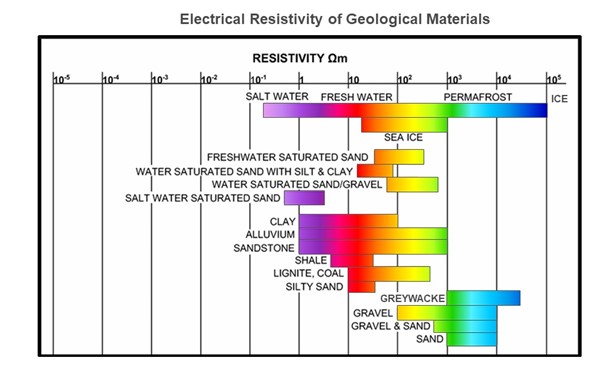
Download the Electrical Resistivity of Geographical Materials graph (JPG 45 KB)
There is not a one-to-one relationship between electrical resistivity and the different types of layers we might find underground. Electromagnetic waves are sensitive to many properties like rock type, porosity, permeability, clay content, moisture content and other fluid properties such as temperature and dissolved electrolytes. However, we can make some general correlations based on what we do know about the ranges of resistivity values. For example, gravels are poor conductors of electricity which means they have high resistivity and indicate layers that are more likely to hold groundwater. Clays and silts (unlikely to hold groundwater) are good conductors and therefore have low resistivity.
A resistivity model for the Ruamāhanga has been built to help identify the layers of the different rocks including gravels, sands, silts and clays to depths we haven’t seen before. This 3D model was built by stitching together the 1D resistivity models at each individual point taken during the survey across the whole valley using established geophysical approaches. Scientists from GNS, Greater Wellington, and consultants worked together to refine the processing and modelling against what we already know using supporting evidence like geological maps, previous geophysical studies, and borehole logs. They also assigned areas where they had high confidence in the model and areas where they had lower confidence. Aarhus University in Denmark also reviewed the data processing and model development.
An example of this process is shown in the cross section across the valley showing resistivity against the subsurface layers (lithology) profiles of three boreholes. Here, areas of high resistivity are shown in blues which match the gravels (in orange) within the three bores, while areas of low resistivity shown in reds are consistent with the underlying clay (in grey) material in one of the bores. The more transparent colours of the resistivity model indicate depths where there is less confidence in the model.
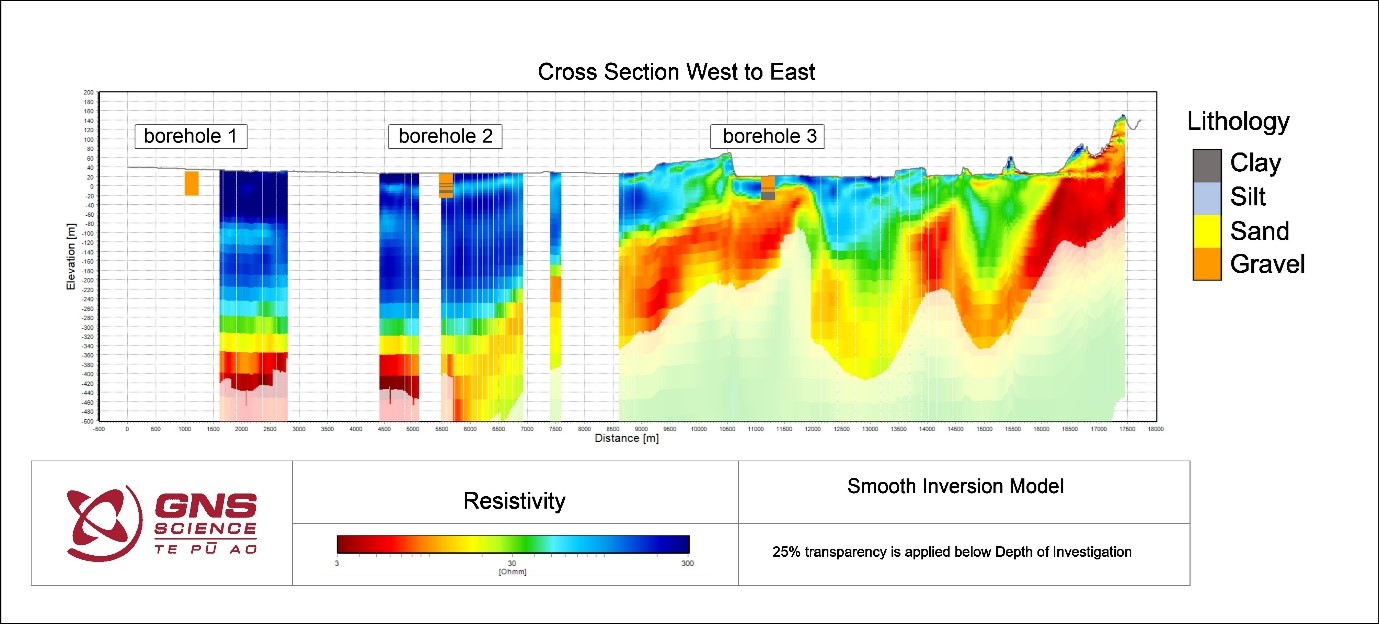
Download the Cross Section West to East graph (JPG 165 KB)
Creating a 3D hydrogeological model
The next step was to develop a 3D representation of the hydrogeological units to identify which areas have the potential to hold water-bearing material.
This model is built using the resistivity model and the supporting geological evidence to identify and group areas of rocks and sediment with similar resistivity characteristics and geological age into major hydrogeological units. For example, silts and clays indicating confining layers that do not allow much water to travel through, gravels and sands at shallow or deeper depths likely to indicate potential shallow or deep aquifer units, and non-aquifer basement rock.
Creating a 3D Aquifer Potential model
An aquifer potential model was developed using outputs from the hydrogeological and resistivity models broken down into cells. Further expert analysis was used to determine the likelihood of each of the model cells as containing material that was able to act as an aquifer to create aquifer potential classes. High aquifer potential indicates an area has a greater potential for hosting water-bearing material (i.e., a productive aquifer) than a low aquifer potential area.
The ‘Technical reports’ section provides detailed scientific reports describing the data and methods used to build the models.
The table below shows where and when the SkyTEM helicopter flew during the survey period (29 January – 2 March 2023)
| When | Where | Map |
|---|---|---|
| 3 March 2023 |
And that’s a wrap! Thanks to a few good days of weather, we were able to finish our final flights and wave goodbye to the helicopter and loop. We collected a huge amount of data about Wairarapa aquifers during these flights! So, it’ll take two years to analyse this data and develop a 3D map of the Ruamāhanga Valley’s aquifers. |
 Click for full picture Click for full picture
|
| 23 Feb - 2 Mar 2023 |
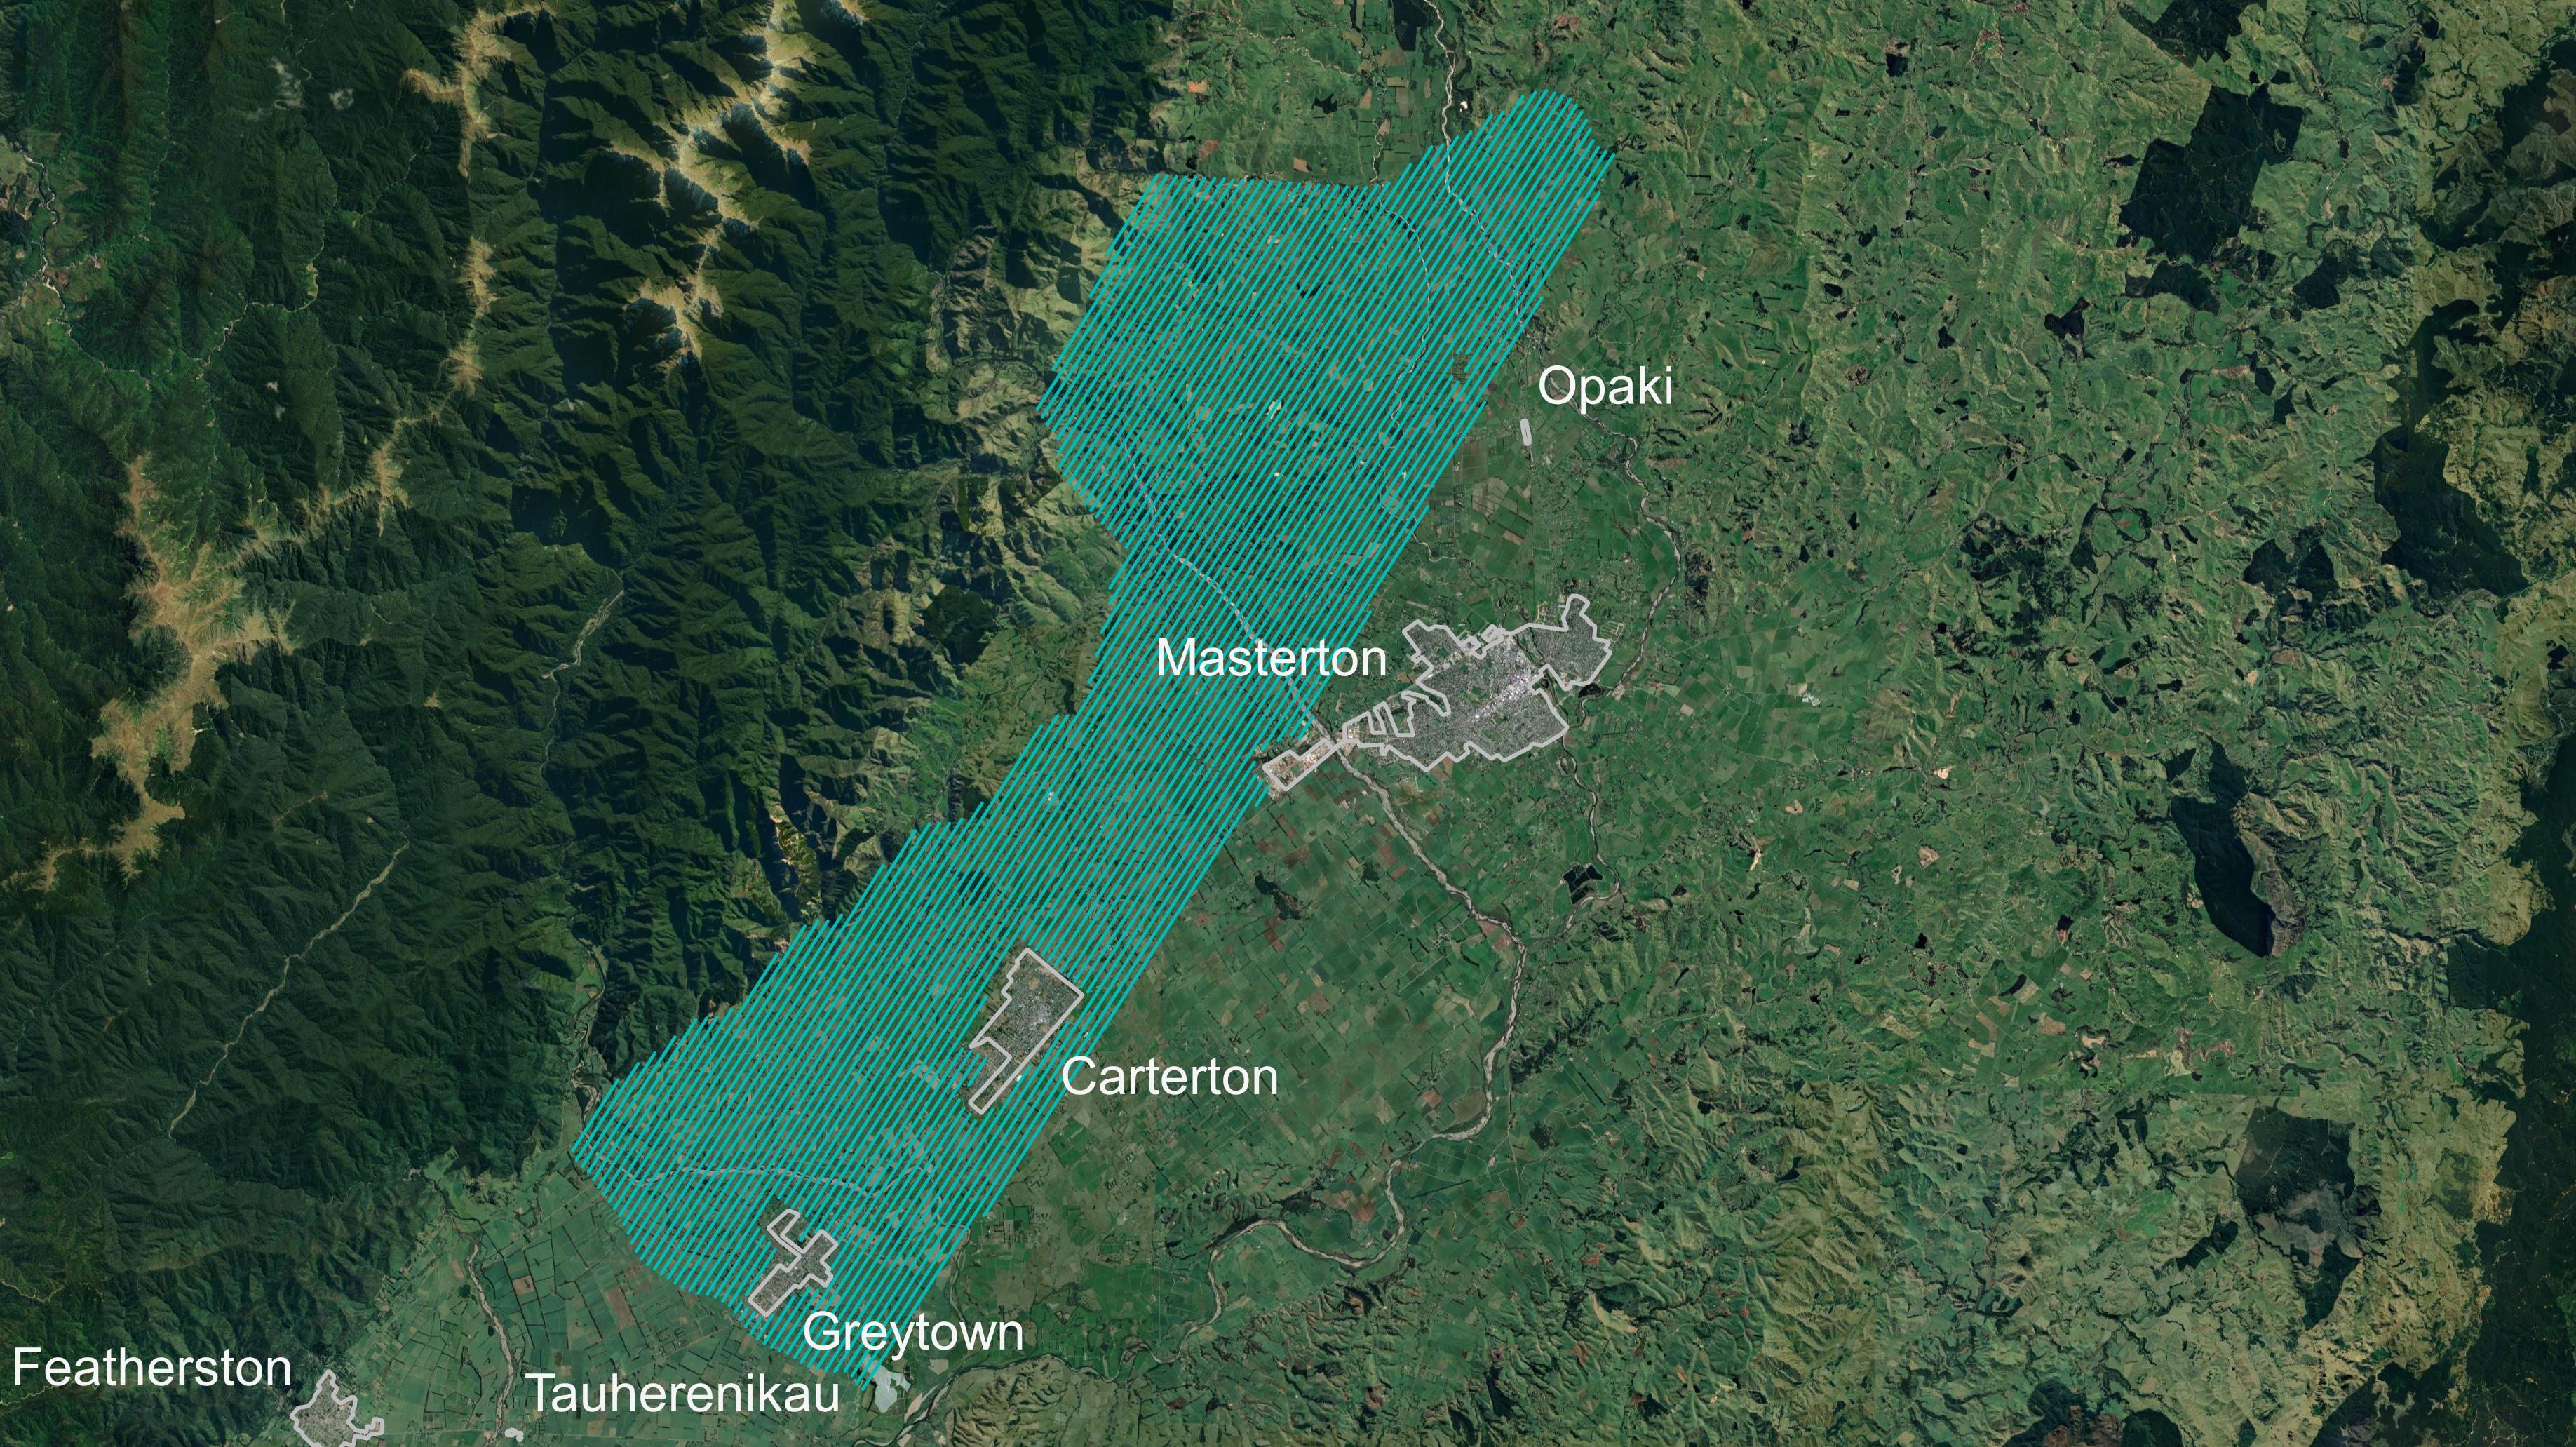
We’ve passed the halfway point in this survey! Over the last few days, we’ve been surveying the area west of Greytown, Carterton, and Masterton. From 23 February we’ll fly around the outside of these towns and to the east of Masterton. Important note: We don’t fly over towns, just rural areas. That’s because metal interferes with the equipment signal and there is a lot of metal in buildings in urban areas. Do you know how high we fly? Our helicopter files around 80-metres above the ground. That means the survey equipment suspended below it will be around 50-metres above the ground. People have told us the level of noise is like a big truck driving past on the highway. |
Click for full picture
|
| 21 – 22 Feb 2023 |
Next, we’ll focus on the northern part of the Wairarapa Valley, which includes working around the edges of Greytown, Carterton and Masterton. But, we don’t fly over towns, just rural areas. So you won’t see us in the air over these towns. |
 Click for full picture Click for full picture
|
| 18 – 20 Feb 2023 |
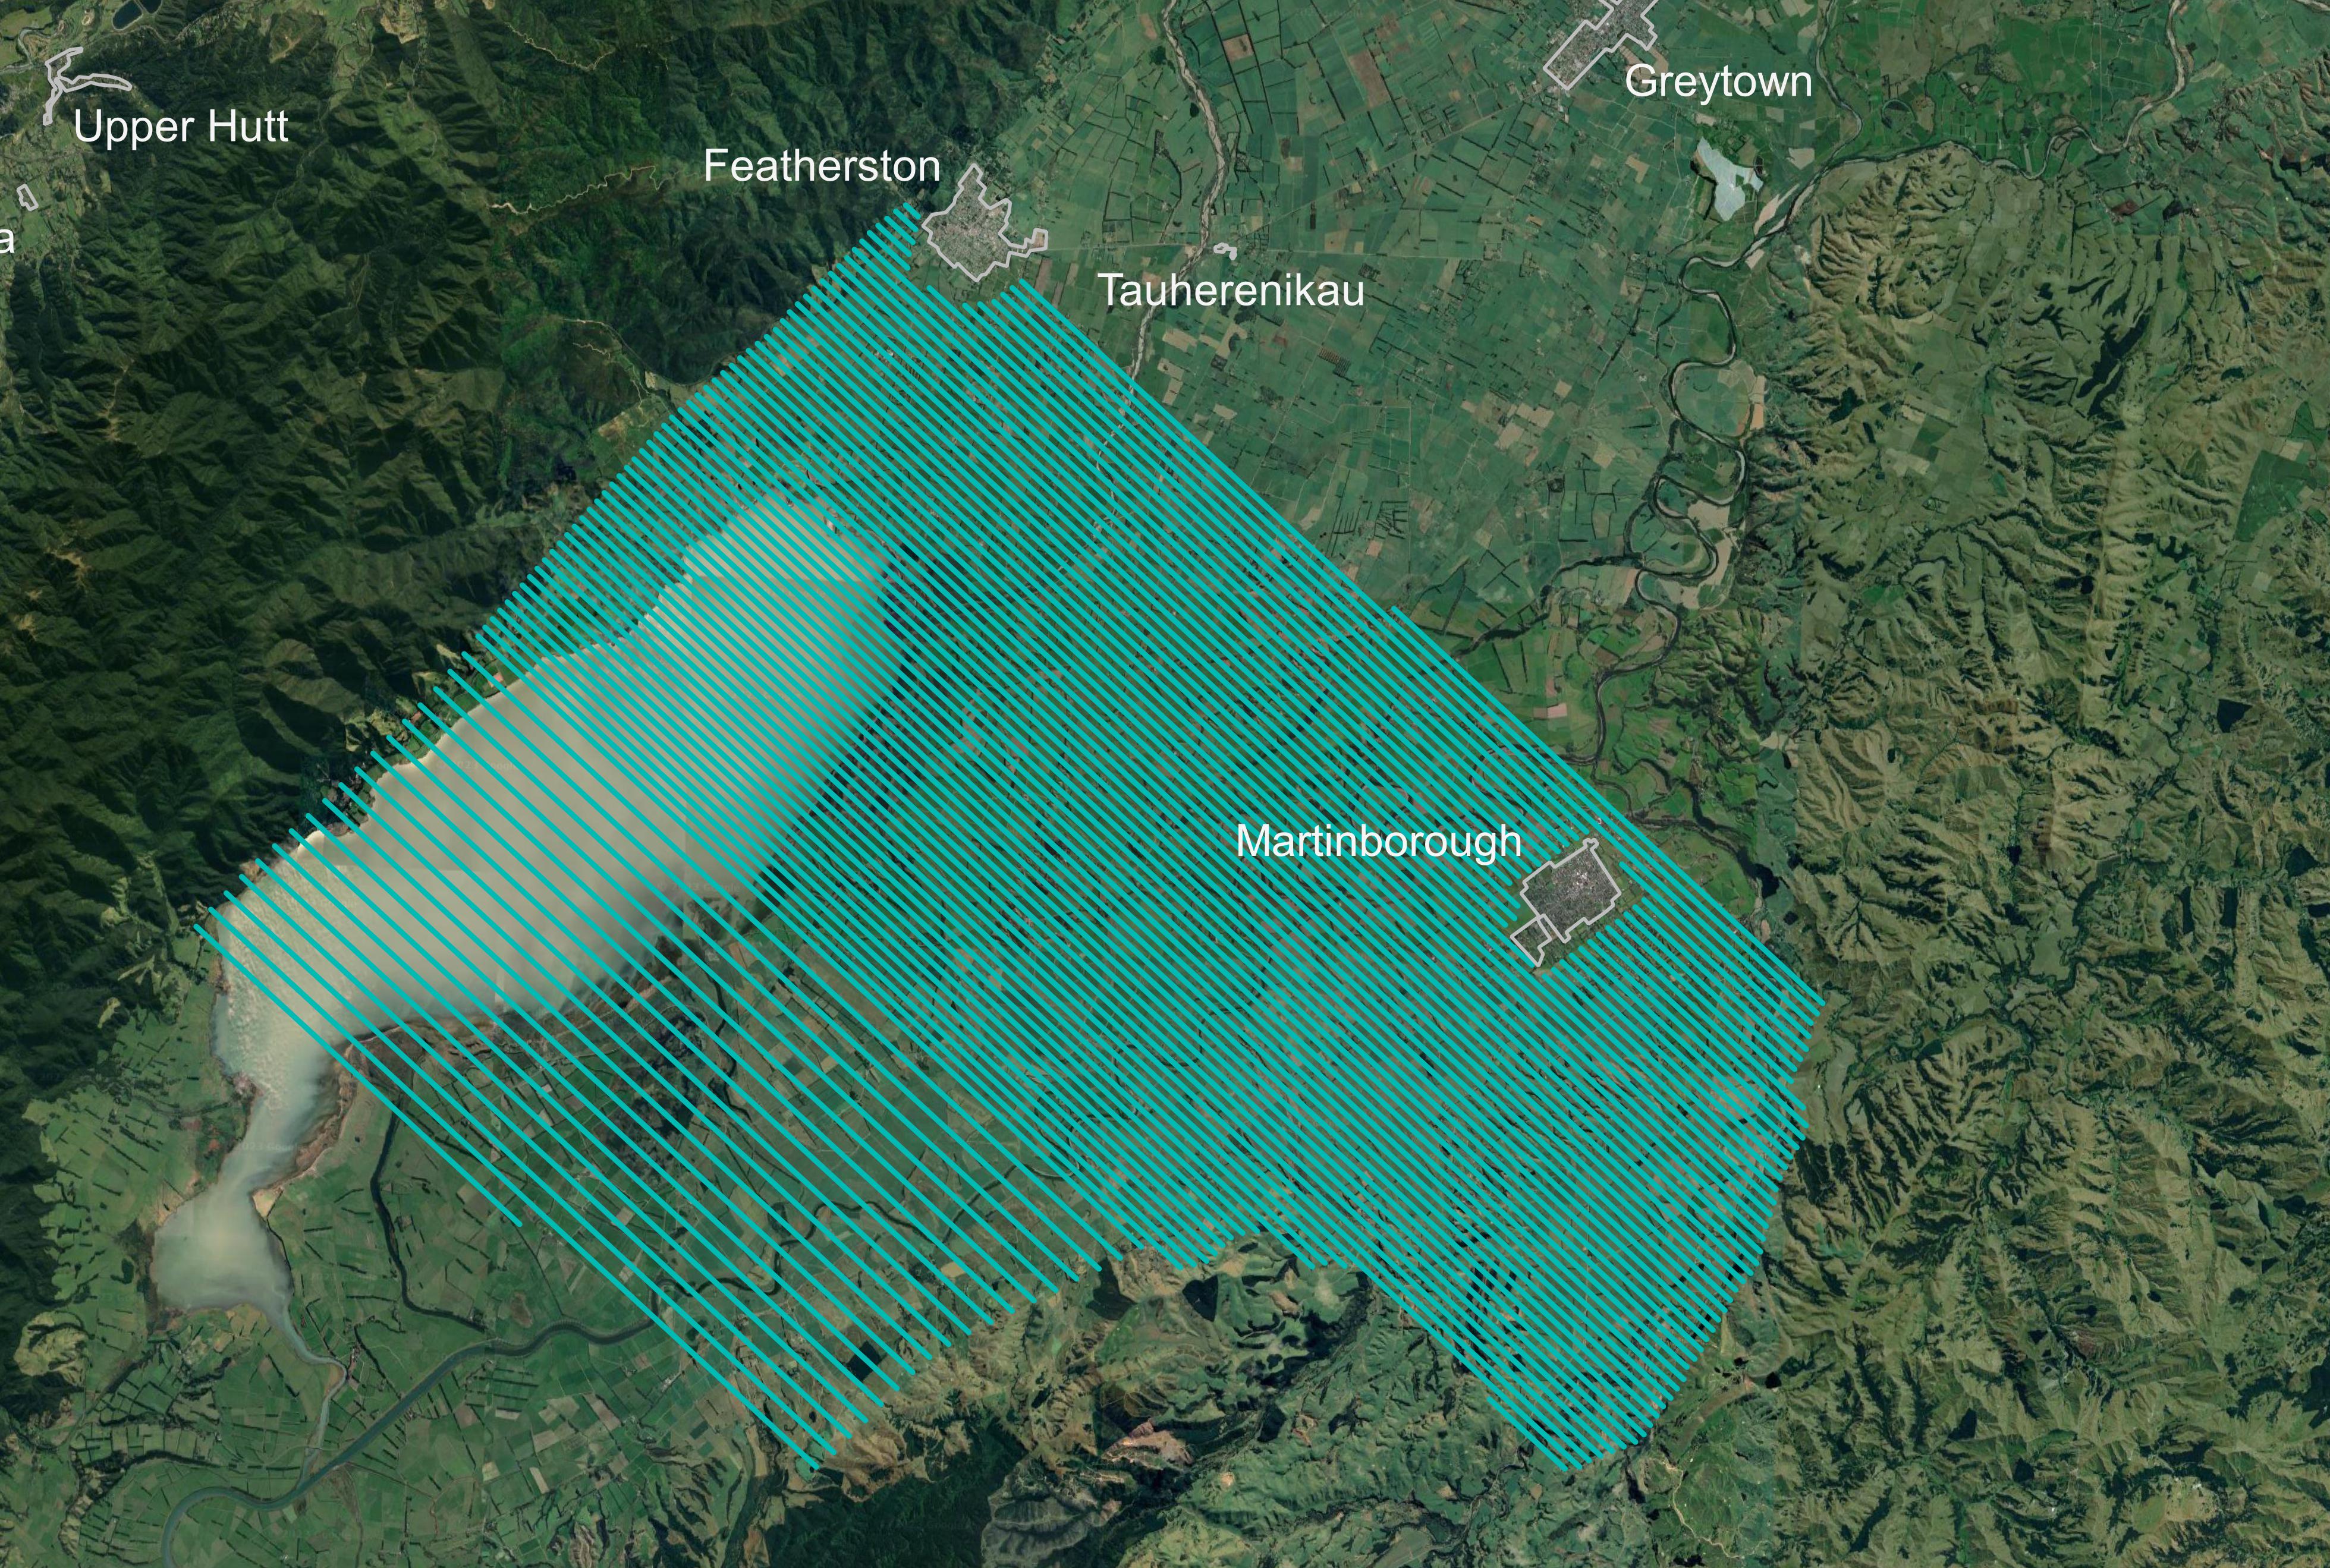
If the weather is fine enough – we’ll carry on surveying the area we were covering before Cyclone Gabrielle. This area was the central and northern part of Lake Wairarapa - extending across to Martinborough and the hills to the east. Work in this location had been taking a bit longer than we originally planned due to poor weather conditions. A reminder that we don’t fly over towns, just rural areas. So you won’t see us in the air over Martinborough or Featherston. |
 Click for full picture Click for full picture
|
| 14 Feb 2023 |
We’ve had to pause flights due to severe weather and strong winds caused by Cyclone Gabrielle. We’ll update you again when flights resume. |
|
| 11 – 13 Feb 2023 |
Flights continue over the central and northern part of Lake Wairarapa and extend across to Martinborough and the hills to the east. If the weather is fine and settled, we’ll start approaching the southern edge of Featherston. But we don’t fly over towns, just rural areas. So you won’t see us in the air over Martinborough or Featherston. |
Click for full picture
|
| 8 - 10 Feb 2023 |
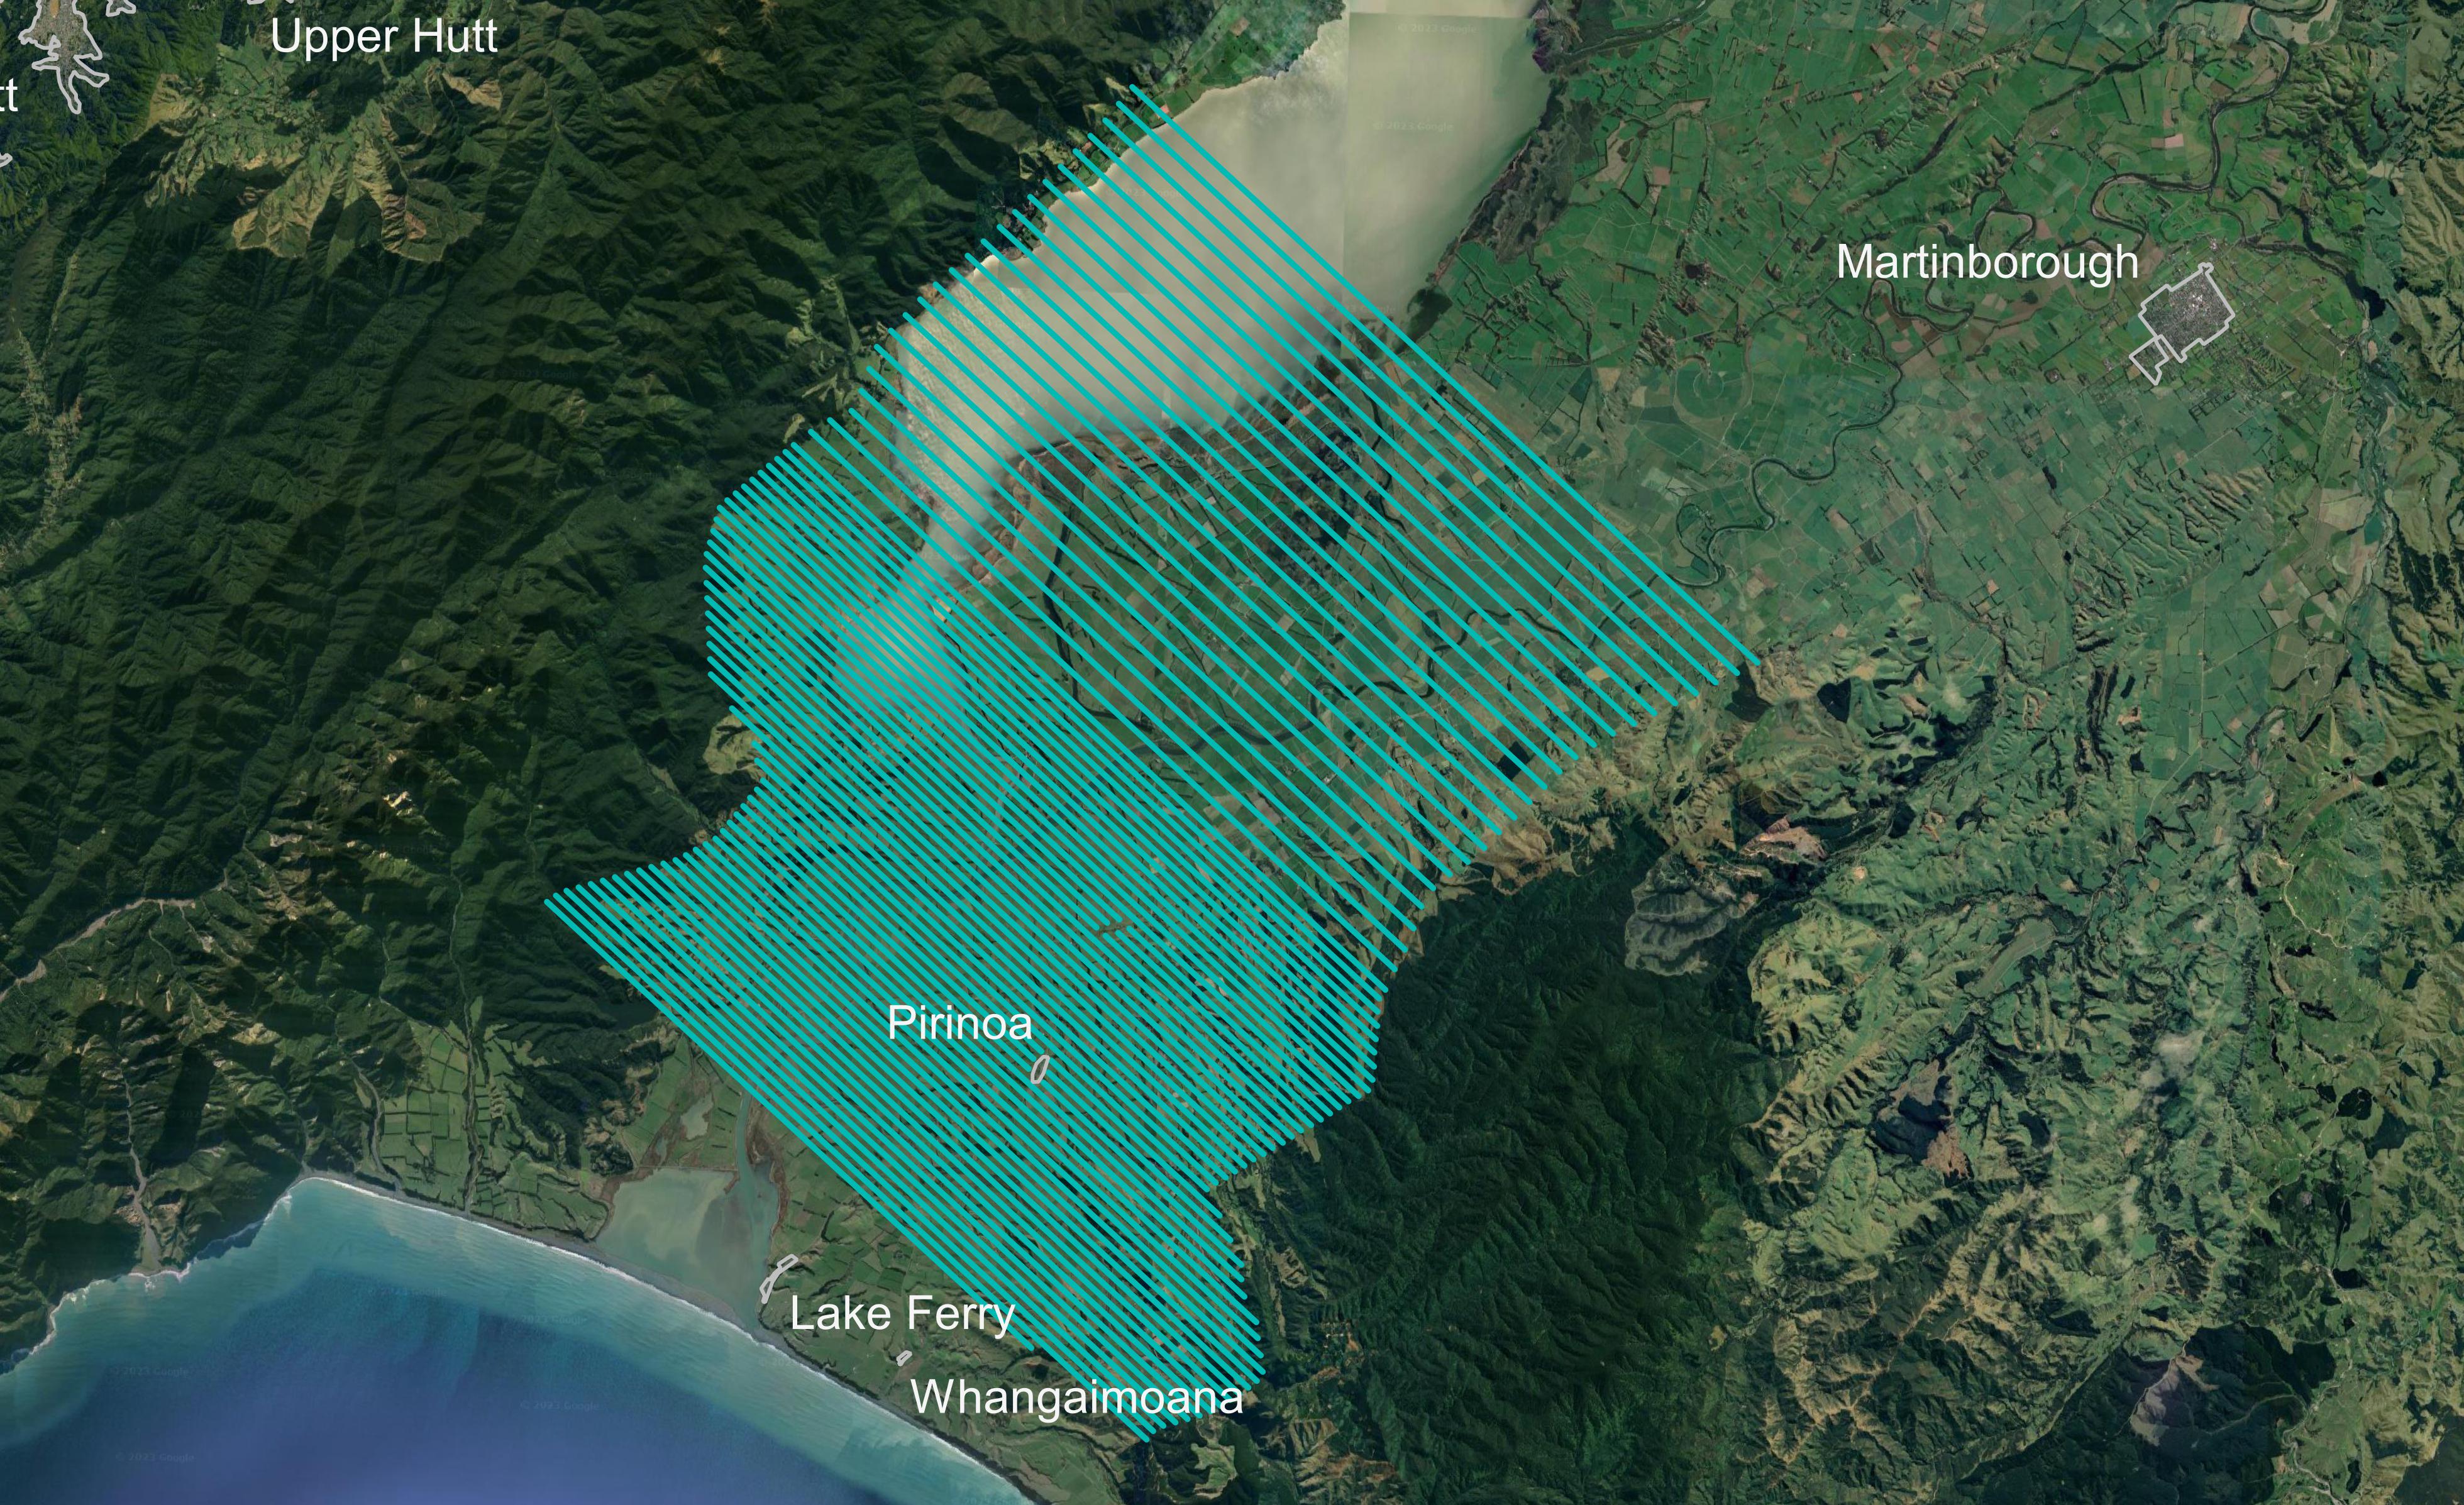
We’re planning to fly north of Lake Onoke - potentially as far north as central Lake Wairarapa. |
 Click for full image Click for full image
|
| 3 - 7 Feb 2023 |
We’ll continue flying in long lines across the valley to calibrate our equipment. Then we’ll start surveying from the coast in the south to the southern end of Lake Wairarapa. But at the time of posting rain is predicted, so this plan could change. Note: Strong winds impacted this flight plan. |
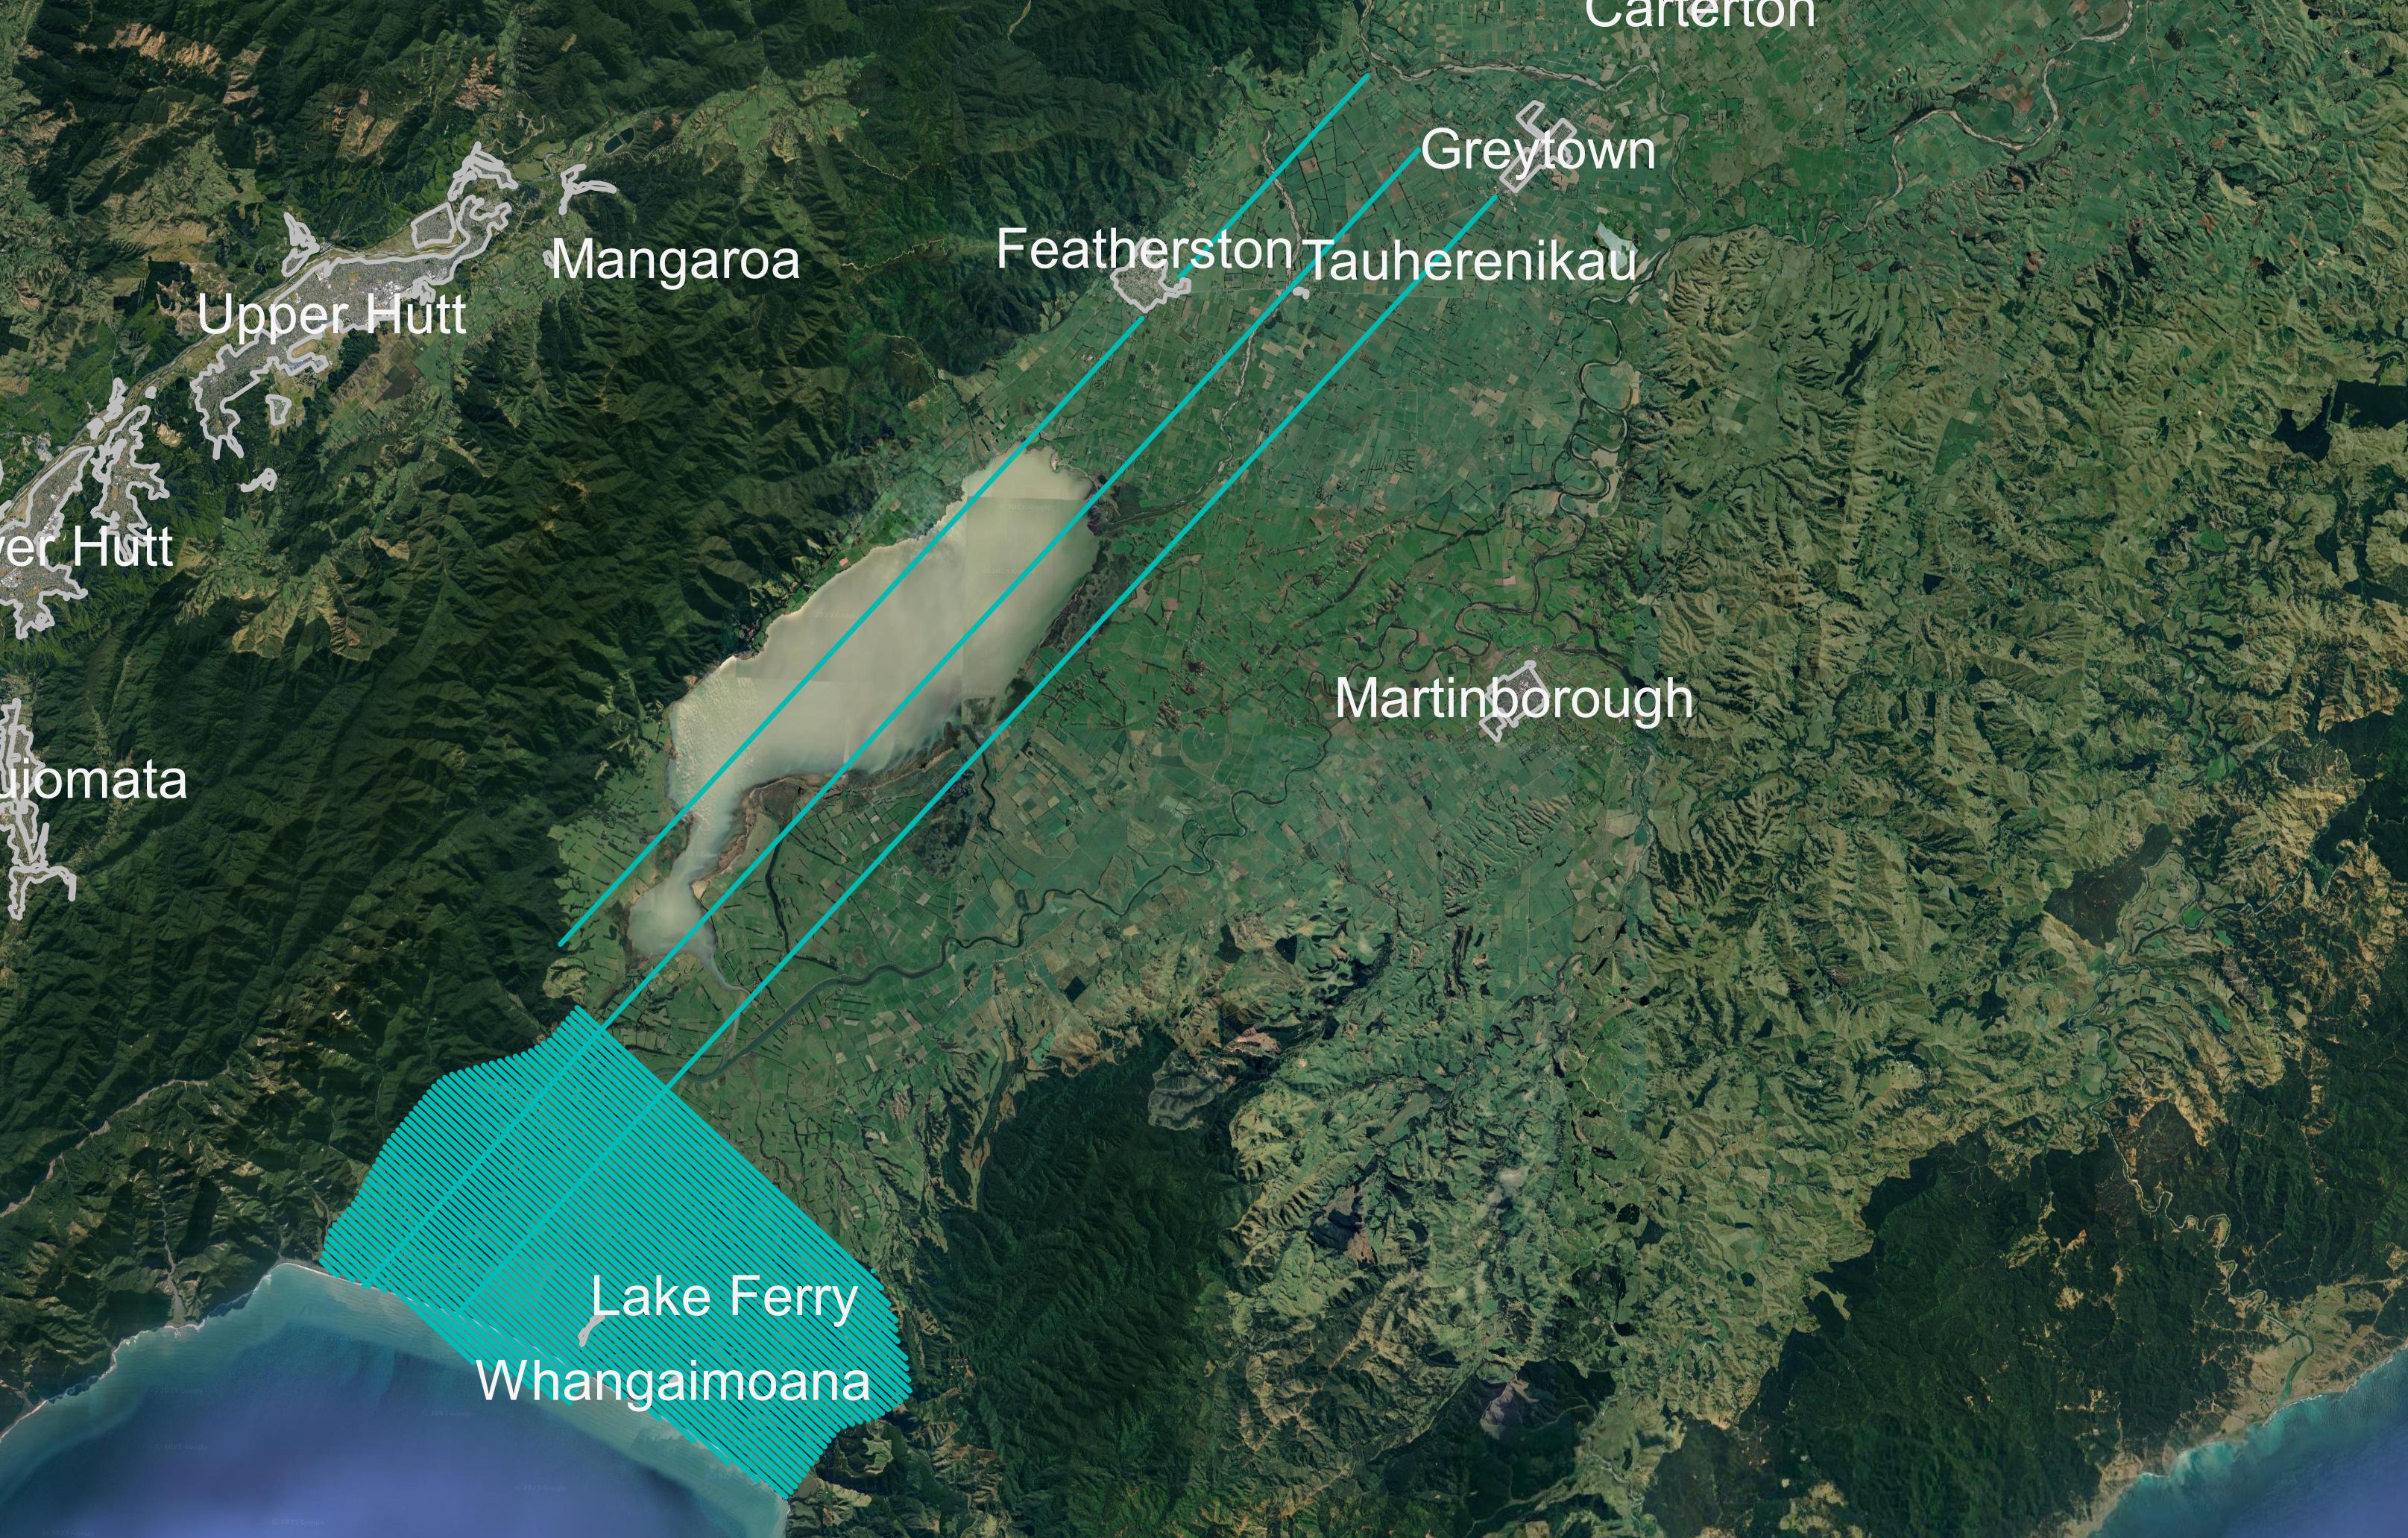 Click for full image Click for full image
|
| 29 Jan – 2 Feb 2023 | We’re conducting initial flights across the Ruamāhanga Valley to help us prepare to survey specific areas. |
 Click for full image Click for full image
|
Review of the Wairarapa Airborne Electromagnetic Survey Acquisition and Deliverables
date_range Published 20 Dec 2023
Download now (PDF 163 KB) get_appSkyTEM helicopter EM survey: Wairarapa 3D aquifer mapping AEM survey, Ruamāhanga Valley Wairarapa, NZ

date_range Published 20 Dec 2023
Download now (PDF 15 MB) get_appReview of the Ruamāhanga SkyTEM dataset and products
this letter documents the detailed review of the Ruamāhanga SkyTEM datasets and products.
Please see our RuamāhangaSkyTEM project webpage for more information on this project.
Author: Kass A.
Read more here
date_range Published 19 Jun 2024
Download now (PDF 106 KB) get_appRuamāhanga Airborne Aquifer Mapping Project: SkyTEM data processing and resistivity models
This project utilises airborne electromagnetic survey technology (SkyTEM) to improve groundwater resource potential mapping and 3D modelling of the spatial extent of the potential aquifers within the Ruamāhanga Valley. This… Read more here
date_range Published 19 Jun 2024
Download now (PDF 54 MB) get_appRuamāhanga Airborne Aquifer Mapping Project: Phase 2 hydrogeological model

This project utilises airborne electromagnetic survey technology (SkyTEM) to improve groundwater resource potential mapping and 3D modelling of the spatial extent of the potential aquifers within the Ruamāhanga Valley. This… Read more here
date_range Published 30 Jun 2025
Download now (PDF 42 MB) get_appNote: A series of GIS, Leapfrog, and other working data files are available for expert users on request. These are too big to load onto the webpage so please contact us at info@gw.govt.nz to discuss access.
If you have any questions about SkyTEM or the data collected, you can email us at info@gw.govt.nz.
Get in touch
- Phone:
- 0800 496 734
- Email:
- info@gw.govt.nz